
US Dollar Index finds footing in Thursday backslide but still lower on the day
- DXY is softly lower on Thursday after US data comes in mixed.
- Losses remain limited as Greenback keeps downside contained.
- Investors pivot to Friday’s key US inflation print.
The US Dollar Index (DXY) showed the Greenback giving a mixed performance on Thursday, testing into the low side after a mixed bag of US data figures but finding enough footing to limit losses. The US Dollar is mixed across the major currencies board, down a thin quarter of a percent against the Euro (EUR) and up a scant sixth of a percent against the Swiss Franc (CHF).
US Initial Jobless Claims for the week ended June 21 were better than expected, with 233K new jobless benefits seekers compared to the forecasted 236K, and slightly down from the previous week’s 238K. The four-week average for Initial Jobless Claims increased to 236K, but this still remains below the running average.
The US Gross Domestic Product (GDP) met expectations on Thursday, with a slight revision to 1.4% from the initial reading of 1.3%. Additionally, Core Personal Consumption Expenditures for the first quarter rose slightly to 3.7% quarter-on-quarter, versus the forecasted 3.6%. Following Thursday's market close, the upcoming Presidential debate will attract attention as investors anticipate possible policy hints from the candidates.
On Friday, the US PCE Price Index inflation print will be the week's focal data point, as investors hope for continued cooling in US inflation numbers to potentially influence the Federal Reserve's (Fed) decisions on rate cuts. Currently, core PCE Price Index inflation is forecasted to decrease to 0.1% month-on-month in May from 0.2%.
DXY technical outlook
Thursday’s limited downside leaves the Dollar Index still holding onto a near-term bullish stance, with the DXY trading on the north side of the 200-hour Exponential Moving Average (EMA) at 105.58. The DXY hit a two-month peak this week, clipping above 106.10 as the Greenback basket follows a rough channel higher.
DXY hourly chart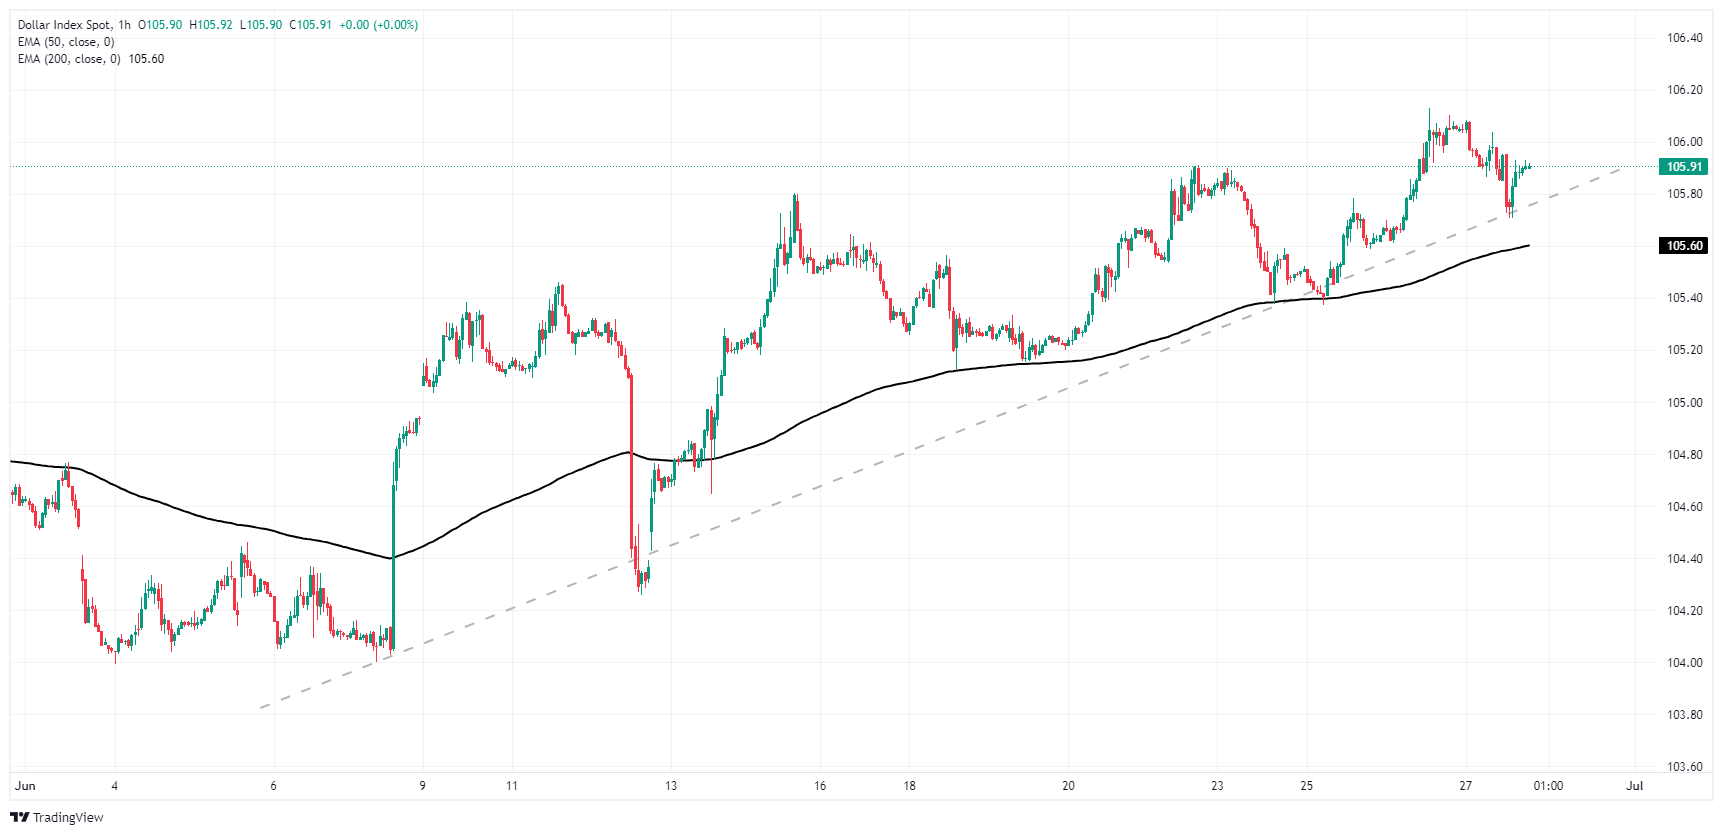
DXY daily chart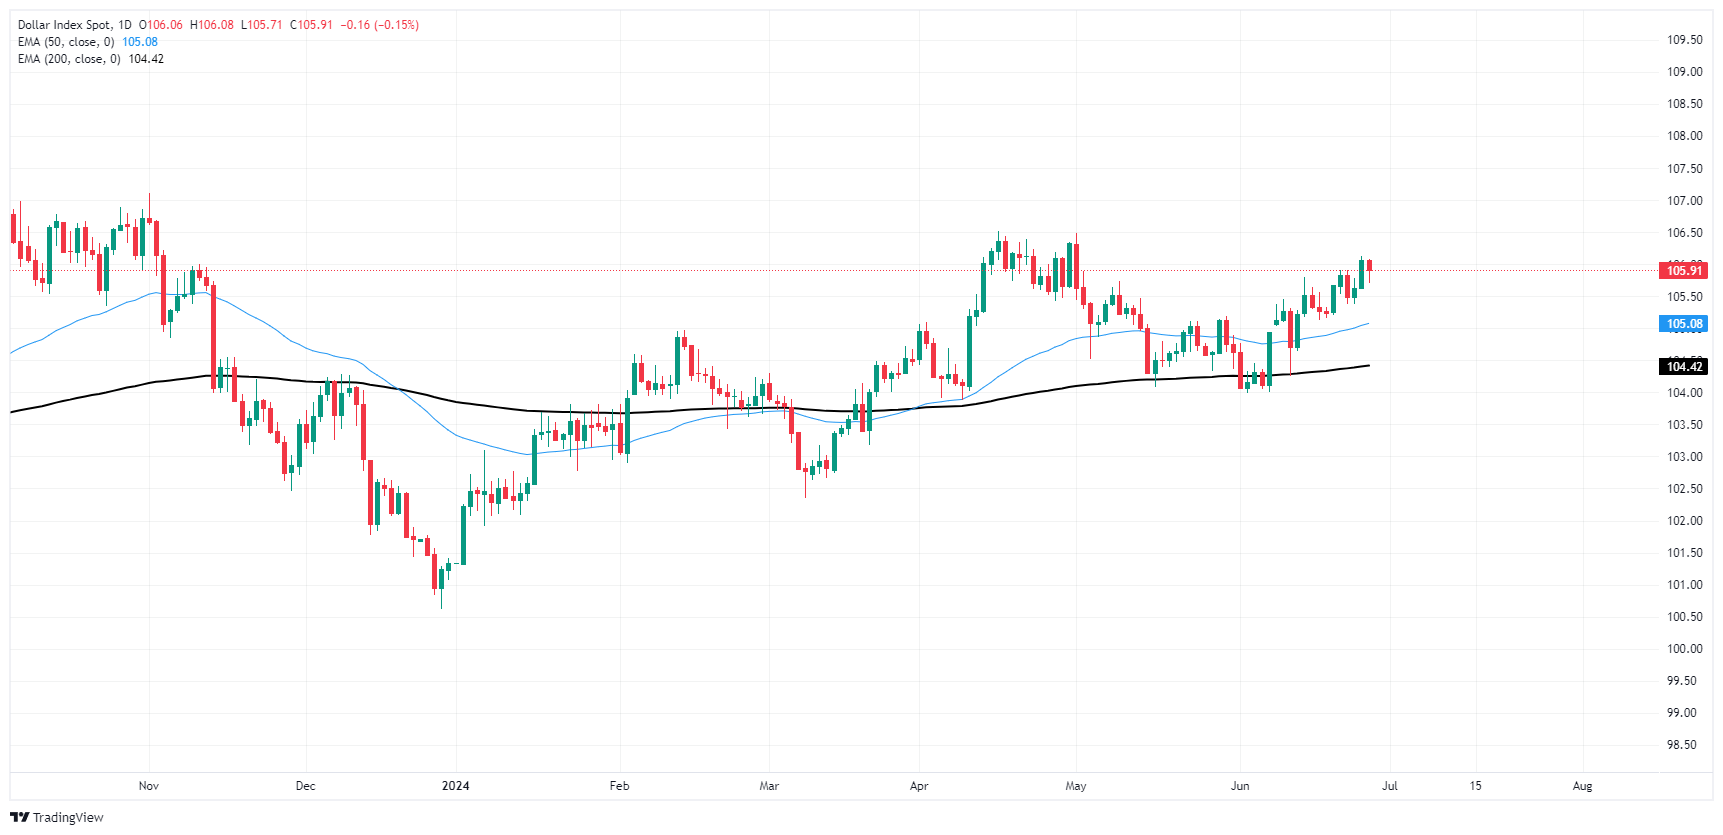
US Dollar FAQs
The US Dollar (USD) is the official currency of the United States of America, and the ‘de facto’ currency of a significant number of other countries where it is found in circulation alongside local notes. It is the most heavily traded currency in the world, accounting for over 88% of all global foreign exchange turnover, or an average of $6.6 trillion in transactions per day, according to data from 2022. Following the second world war, the USD took over from the British Pound as the world’s reserve currency. For most of its history, the US Dollar was backed by Gold, until the Bretton Woods Agreement in 1971 when the Gold Standard went away.
The most important single factor impacting on the value of the US Dollar is monetary policy, which is shaped by the Federal Reserve (Fed). The Fed has two mandates: to achieve price stability (control inflation) and foster full employment. Its primary tool to achieve these two goals is by adjusting interest rates. When prices are rising too quickly and inflation is above the Fed’s 2% target, the Fed will raise rates, which helps the USD value. When inflation falls below 2% or the Unemployment Rate is too high, the Fed may lower interest rates, which weighs on the Greenback.
In extreme situations, the Federal Reserve can also print more Dollars and enact quantitative easing (QE). QE is the process by which the Fed substantially increases the flow of credit in a stuck financial system. It is a non-standard policy measure used when credit has dried up because banks will not lend to each other (out of the fear of counterparty default). It is a last resort when simply lowering interest rates is unlikely to achieve the necessary result. It was the Fed’s weapon of choice to combat the credit crunch that occurred during the Great Financial Crisis in 2008. It involves the Fed printing more Dollars and using them to buy US government bonds predominantly from financial institutions. QE usually leads to a weaker US Dollar.
Quantitative tightening (QT) is the reverse process whereby the Federal Reserve stops buying bonds from financial institutions and does not reinvest the principal from the bonds it holds maturing in new purchases. It is usually positive for the US Dollar.
Artigos Recomendados


