
Could profit-taking from FLOKI holders lower its price?
- Trading bot that will burn FLOKI tokens announcement fails to impact its price.
- FLOKI's In-the-Money Addresses reveal a sharper correction may occur if the market continues its downward movement.
- FLOKI's Token Age Consumed shows long-term holders may have been taking profits.
FLOKI is down nearly 6% on Wednesday, as key on-chain metrics and speculations suggest that investors may enter a profit-taking spree if its price encounters a steep decline.
FLOKI holders are likely to take profit if price declines further
The FLOKI team recently launched a Telegram trading bot that will buy and burn FLOKI tokens with 50% of its generated fees. The aim is to make FLOKI deflationary over time. While the move should have signaled a bullish sentiment, FLOKI is down by almost 6% in the past 24 hours as its on-chain metrics reveal a potential further plunge.
FLOKI's In/Out of the Money data reveals investors may have been shedding their holdings gradually.
In/Out the Money measures the average purchase cost of an asset against its current price. An address/coin is in the money if the current price exceeds its average purchase cost and out of the money if vice versa.
According to data from IntoTheBlock, after FLOKI reached an all-time high of $0.0003449 on June 5, 99% of its holders were in the money. This is similar to its rally on March 1, when 99.3% of holders were also in the money. Although the percentage was the same, the number of in-the-money wallets at the March high was 74K, while that of June increased to 78K.
Additionally, only 76.8% of FLOKI holders are currently in profit. Combining the above data points indicates that FLOKI holders may have gradually been taking profits. Also, with the rise in addresses following its last rally, a sharper correction may ensue if the market downturn persists.
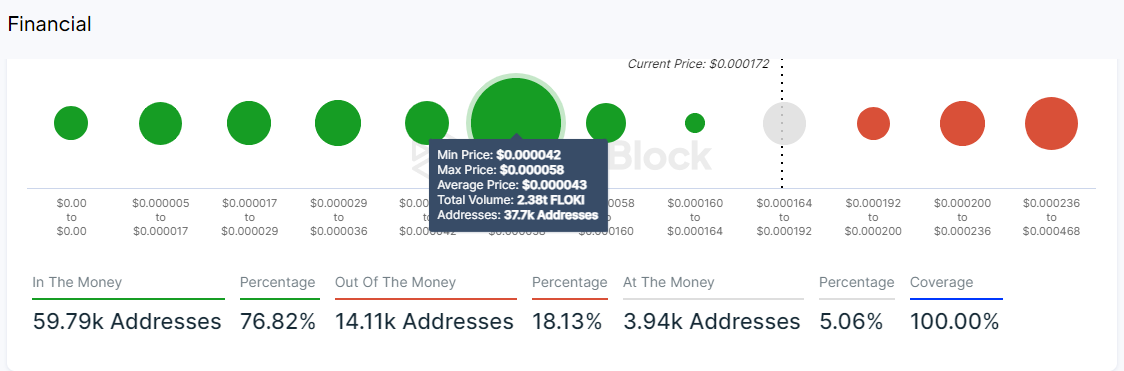
FLOKI Global In/Out of the Money
FLOKI's Token Age Consumed (TAC) metric in the last two weeks also aligns with this view.
Token Age Consumed tracks the movement of previously dormant coins. A spike in the TAC chart indicates that long-term holders are moving their tokens.
According to data from Santiment, between June 5 and 19, FLOKI's TAC hovered around 20 trillion while its price declined by almost 50%, indicating that long-term holders may have been taking profits.
With several crypto community members speculating that the meme coin cycle has ended, FLOKI could see more profit-taking if its price declines further.
Meanwhile, a recently launched Solana meme coin, DORAE, crashed 99% after an insider — potentially the coin's developer — dumped 2.5M of its supply for $1.45 million worth of Solana, according to Lookonchain.
Artigos Recomendados


