
Dogwifhat price breakout signals potential rally above $2.1 resistance
- Dogwifhat price broke a descending trendline on Tuesday and trades above $2 on Wednesday.
- On-chain data shows that the largest WIF holder has accumulated 2.3 million tokens worth $4.67 million.
- A daily candlestick close below $1.54 would invalidate the bullish thesis.
Dogwifhat (WIF) price broke out of a descending trendline on Tuesday and is trading above $2 as of Wednesday. On-chain data reveals that the largest whale has accumulated 2.3 million tokens valued at $4.67 million, indicating potential for an upside rally in the coming days.
WIF whale accumulate
Data from Lookonchain shows that the largest holder of WIF has bought 2.3 million tokens worth $4.67 million. This whale holds 23.39 million WIF tokens worth $49.6 million, with a profit of $83 million.
In addition, the holder also spent 86,738.1 Solana tokens worth $8.65 million in one trade to buy 17.22 million WIF tokens.
The largest holder of $WIF spent 4.65M $USDC to buy 2.3M $WIF at $2.03 8 hours ago!
— Lookonchain (@lookonchain) June 26, 2024
He currently holds 23.39M $WIF($49.6M), with a profit of ~$83M on $WIF!
He is also the one who spent 86,738.1 $SOL($8.65M) to buy 17.22M $WIF in one trade.
Address:https://t.co/5fd4VETnts… pic.twitter.com/EHbdZVBHl9
WIF price shows potential
Dogwifhat price broke out of a descending trendline on Tuesday and is trading above $2 as of Wednesday. This trendline is drawn by joining multiple swing high levels from June 5 to June 25.
If this trendline holds as pullback support and the WIF price closes above the $2.10 daily resistance level, it could rally 25% to retest its daily high of $2.64 from June 17.
The Relative Strength Index (RSI) on the daily chart is rising from an oversold condition and looking to break above the mean value of 50. The Awesome Oscillator (AO) indicator is below the mean zero level. If bulls are indeed making a comeback, then both momentum indicators must maintain their positions above their respective mean levels. This development would provide additional momentum to the ongoing recovery rally.
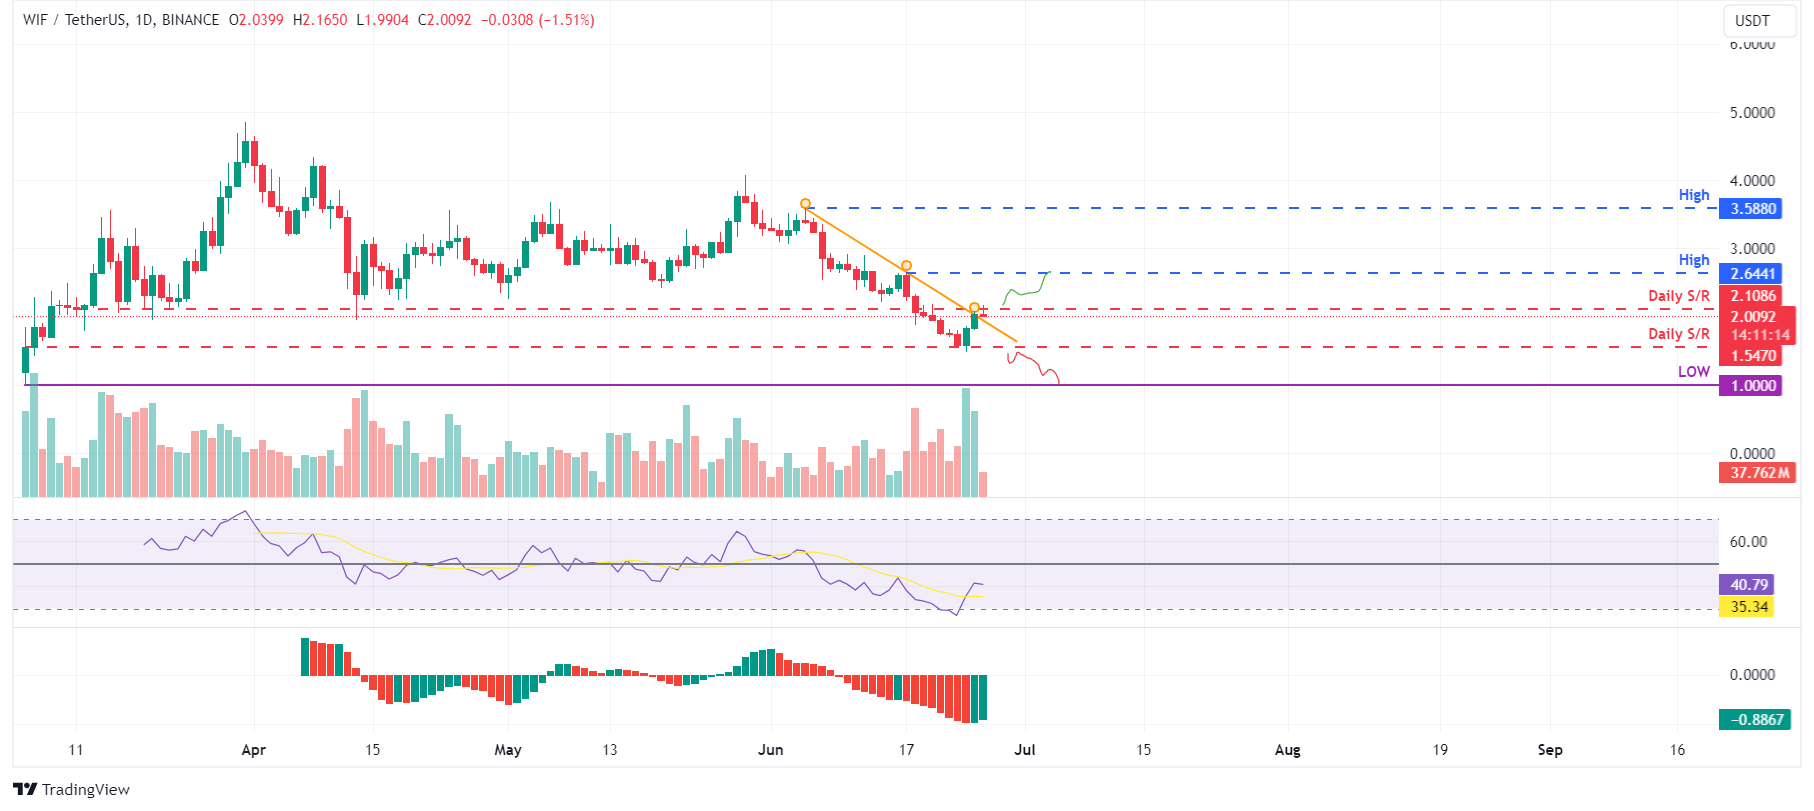
WIF/USDT daily chart
Even though on-chain metric and technical analysis point to a bullish outlook, if Dogwifhat’s price makes a daily candlestick close below $1.54, the bullish thesis would be invalidated by creating a lower low on the daily chart. This development could see WIF's price crash by 35% to retest the March 5 low at $1.
Artigos Recomendados


