
Ripple holders realize over $30 million in losses in the past ten days, XRP fails to recover
- Ripple holders have shed their XRP holdings and realized over $30 million in losses since June 15.
- XRP token supply on exchanges is down to 2.84 million in the same timeframe.
- XRP struggles to surge past $0.48 on Tuesday.
Ripple’s price (XRP) struggles to hold above $0.48 on Tuesday and seems ready to extend its recent decline. According to Santiment data, investors have realized losses on their token holdings in the past ten days. This is typical of market capitulation, with traders likely distributing their tokens at a loss and expecting a decline in the asset’s price.
XRP has steadily declined since the June 17 high of $0.5213, down to $0.47 on Tuesday.
Daily digest market movers: Ripple holders take losses in recent XRP price dip
- Ripple traders distributed their XRP holdings at a loss between June 15 and June 25, Santiment data shows.
- The Network Realized Profit/Loss (NPL) metric shows negative spikes in the timeframe, losses exceed $30 million in the ten-day period.
- Distribution of token holdings at a loss is typically a sign of market capitulation.
- However, in the case of XRP, the supply on exchanges has declined in the past ten days.
- 2.84 million XRP tokens are held on exchanges, down nearly 1% in the same period, signaling a reduction in selling pressure on the altcoin.
- The Santiment chart below shows the decline in exchange supply and the NPL vs. XRP price.
 [14.19.32, 25 Jun, 2024]-638549145050951155.png)
XRP NPL, supply on exchanges and price
- Developments in the SEC vs. Ripple lawsuit are typical market movers for the token.
- There has been no update since the SEC’s response to Ripple on June 14, in which the regulator quotes a $102.6 million fine for the payment remittance firm’s alleged securities violation.
- A California Judge recently dismissed all class action lawsuits against the firm except for one against CEO Brad Garlinghouse, a partial win for Ripple, amidst the long-drawn legal battle with the SEC.
Technical analysis: XRP drops below $0.48
Ripple started its downward trend on March 11, wiping out over 35% of its value till June 25. XRP price trades around $0.4750 on Tuesday, and the altcoin is likely to extend its losses and dip to support at $0.4508, the June 7 low.
Ripple’s drop to $0.4508 would mark a 5% correction in the altcoin’s price. If XRP extends losses further, it could find support at the April 13 low of $0.4188 for an additional 7% fall.
Moving Average Convergence Divergence (MACD) indicator supports the bearish thesis. The red histogram bars below the neutral line signal the underlying negative momentum in Ripple’s price trend.
On the contrary, a daily candlestick close above $0.4955, the 23.6% Fibonacci retracement of the decline between the March 11 top of $0.7440 and the April 13 low of $0.4188 could invalidate the bearish thesis.
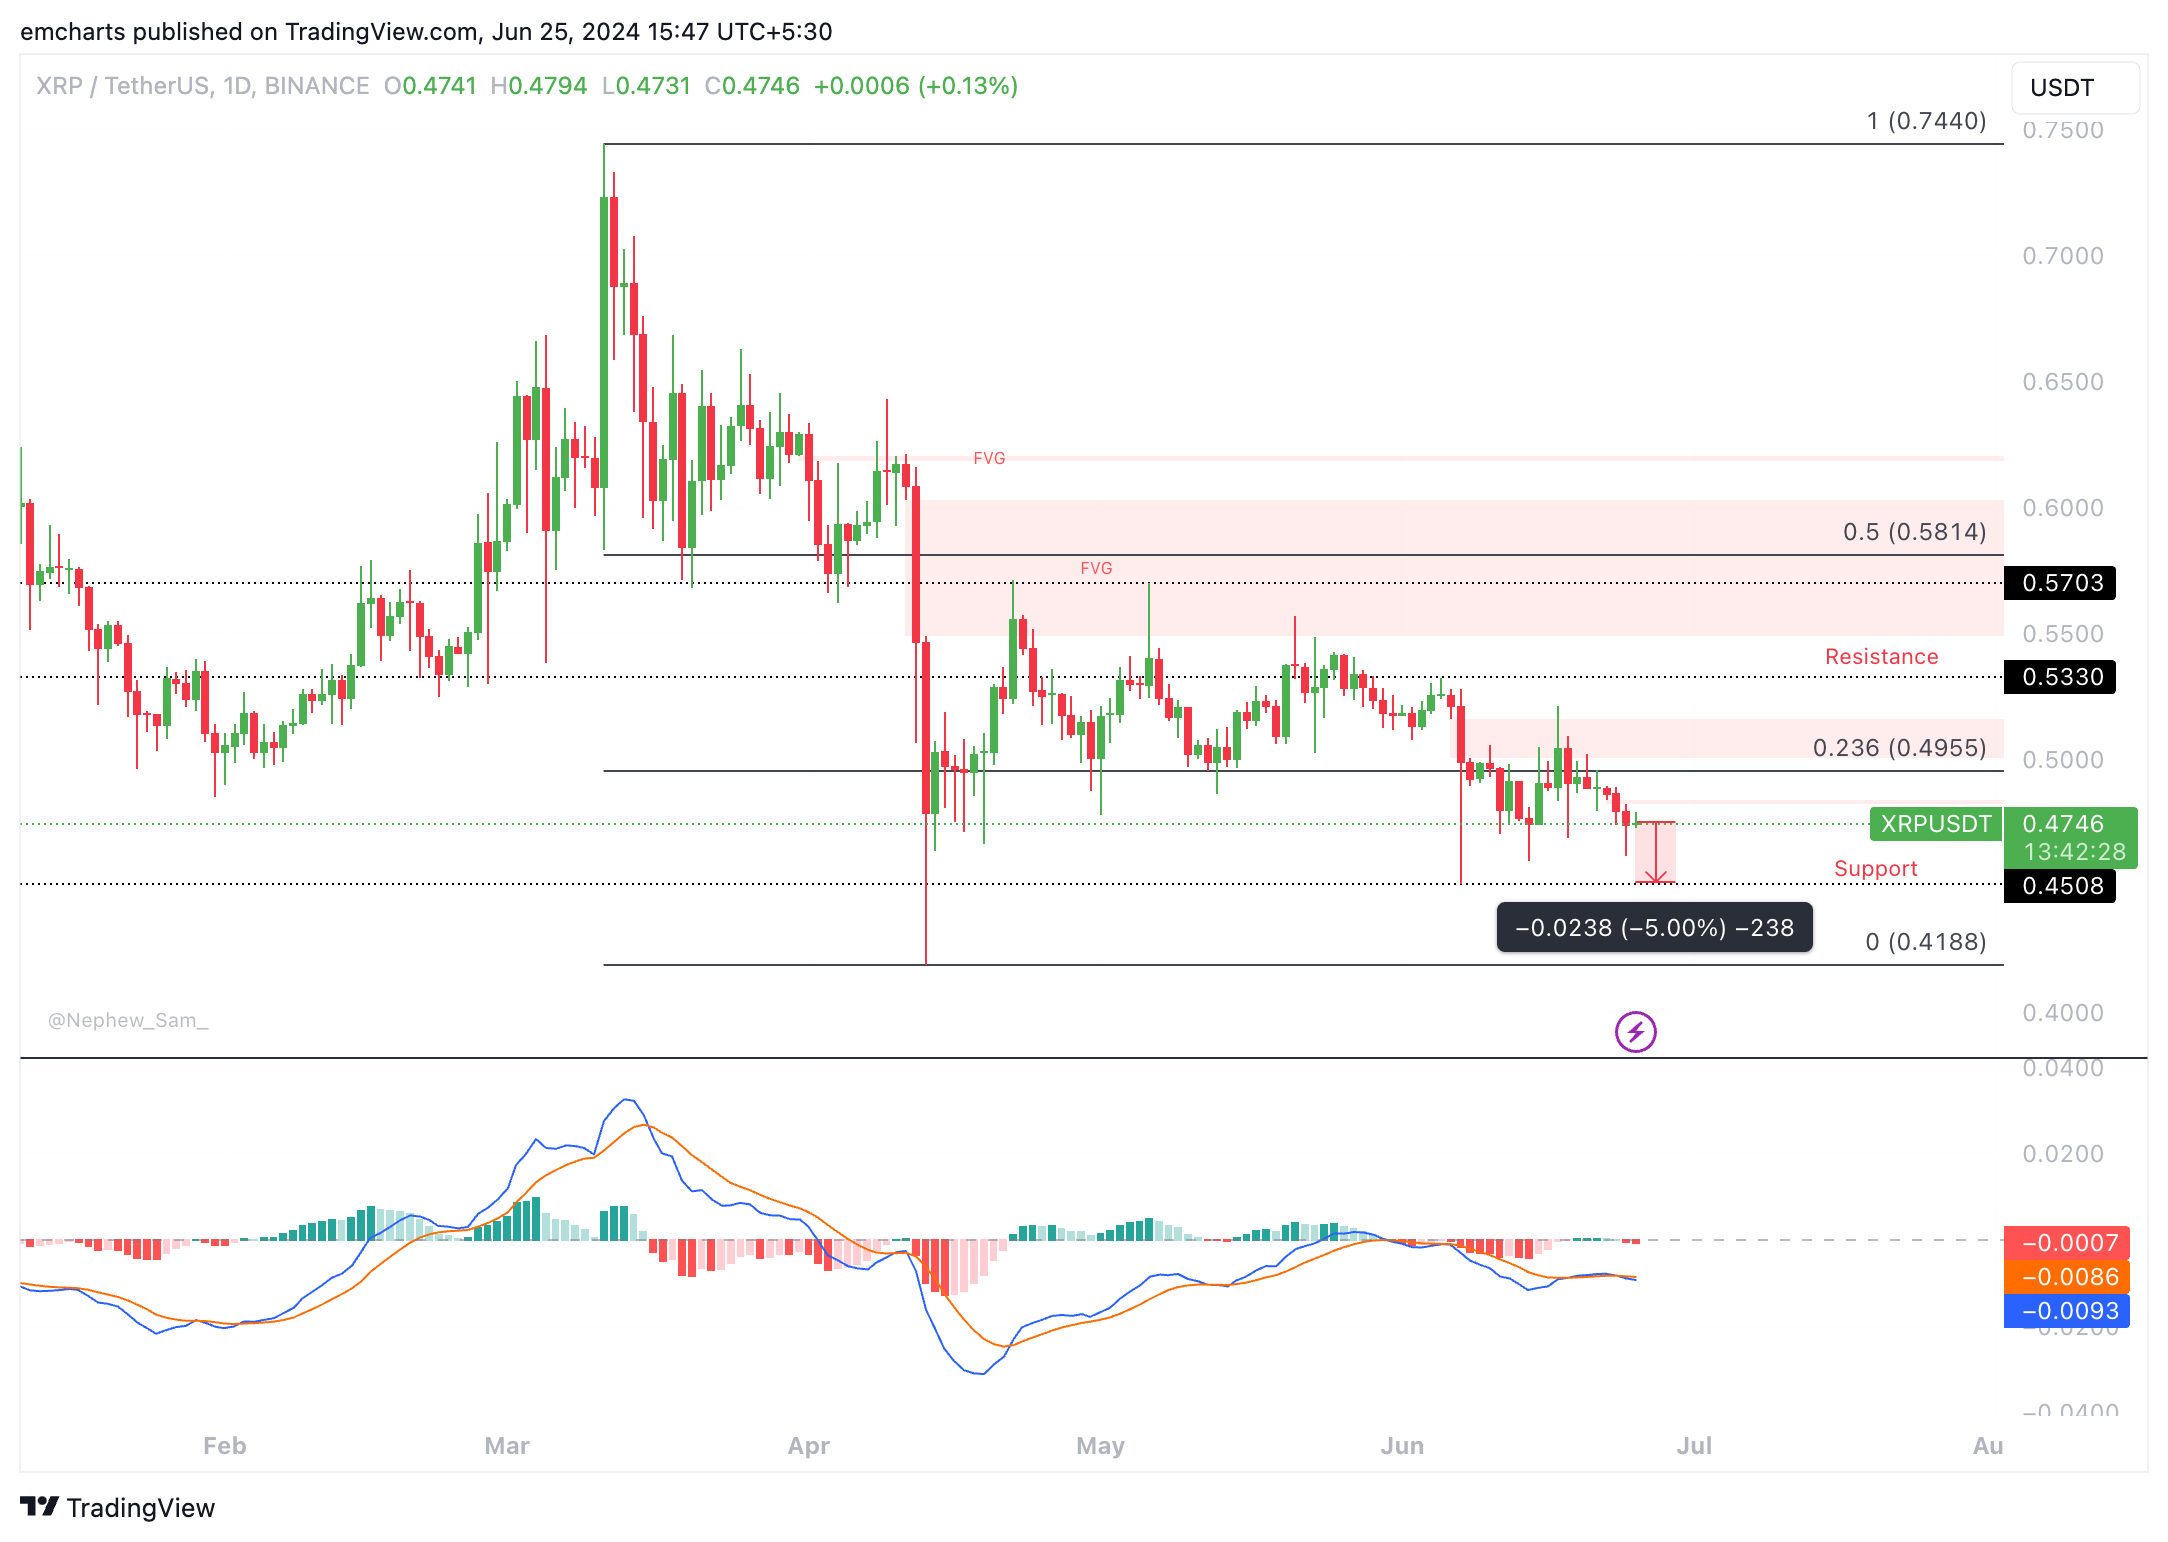
XRP/USDT daily chart
If Ripple price closes above the resistance at $0.4955, XRP could target the Fair Value Gap between $0.5008 and $0.5164. Further up, the next key resistance is $0.5330, the June 5 high.
Bitcoin, altcoins, stablecoins FAQs
Bitcoin is the largest cryptocurrency by market capitalization, a virtual currency designed to serve as money. This form of payment cannot be controlled by any one person, group, or entity, which eliminates the need for third-party participation during financial transactions.
Altcoins are any cryptocurrency apart from Bitcoin, but some also regard Ethereum as a non-altcoin because it is from these two cryptocurrencies that forking happens. If this is true, then Litecoin is the first altcoin, forked from the Bitcoin protocol and, therefore, an “improved” version of it.
Stablecoins are cryptocurrencies designed to have a stable price, with their value backed by a reserve of the asset it represents. To achieve this, the value of any one stablecoin is pegged to a commodity or financial instrument, such as the US Dollar (USD), with its supply regulated by an algorithm or demand. The main goal of stablecoins is to provide an on/off-ramp for investors willing to trade and invest in cryptocurrencies. Stablecoins also allow investors to store value since cryptocurrencies, in general, are subject to volatility.
Bitcoin dominance is the ratio of Bitcoin's market capitalization to the total market capitalization of all cryptocurrencies combined. It provides a clear picture of Bitcoin’s interest among investors. A high BTC dominance typically happens before and during a bull run, in which investors resort to investing in relatively stable and high market capitalization cryptocurrency like Bitcoin. A drop in BTC dominance usually means that investors are moving their capital and/or profits to altcoins in a quest for higher returns, which usually triggers an explosion of altcoin rallies.
Artigos Recomendados


