
Axie Infinity price dips 45% since April even as Axies’ active addresses rise nearly 700%
- Axie NFT collection’s monthly active addresses climbed 690% since April.
- The NFT project has generated more monthly on-chain revenue than most other blue-chip collections in the past 30 days.
- AXS wiped out 45% of its value since April even as Axie NFTs are relevant among investors.
Axie Infinity (AXS) is a gaming finance (GamsFi) token with a virtual world and a game featuring Axies from the NFT collection. AXS has wiped out nearly 45% of its value in the past two months as AXS price has been in a state of decline since April, down from $11.10 on April 1 to $6.22 on June 27, at the time of writing.
The NFT collection’s Axies have generated more monthly on-chain revenue than most other NFTs, per DeFiLlama data.
AXS suffers 45% correction since April, Axies’ popularity persists
Data from DeFi intelligence tracker DeFiLlama shows that the monthly active users of Axies have climbed 690%, from 26,500 to 209,600 between April and June 2024. The blue-chip NFT collection is generating more monthly on-chain revenue relative to others, as seen in the chart below.
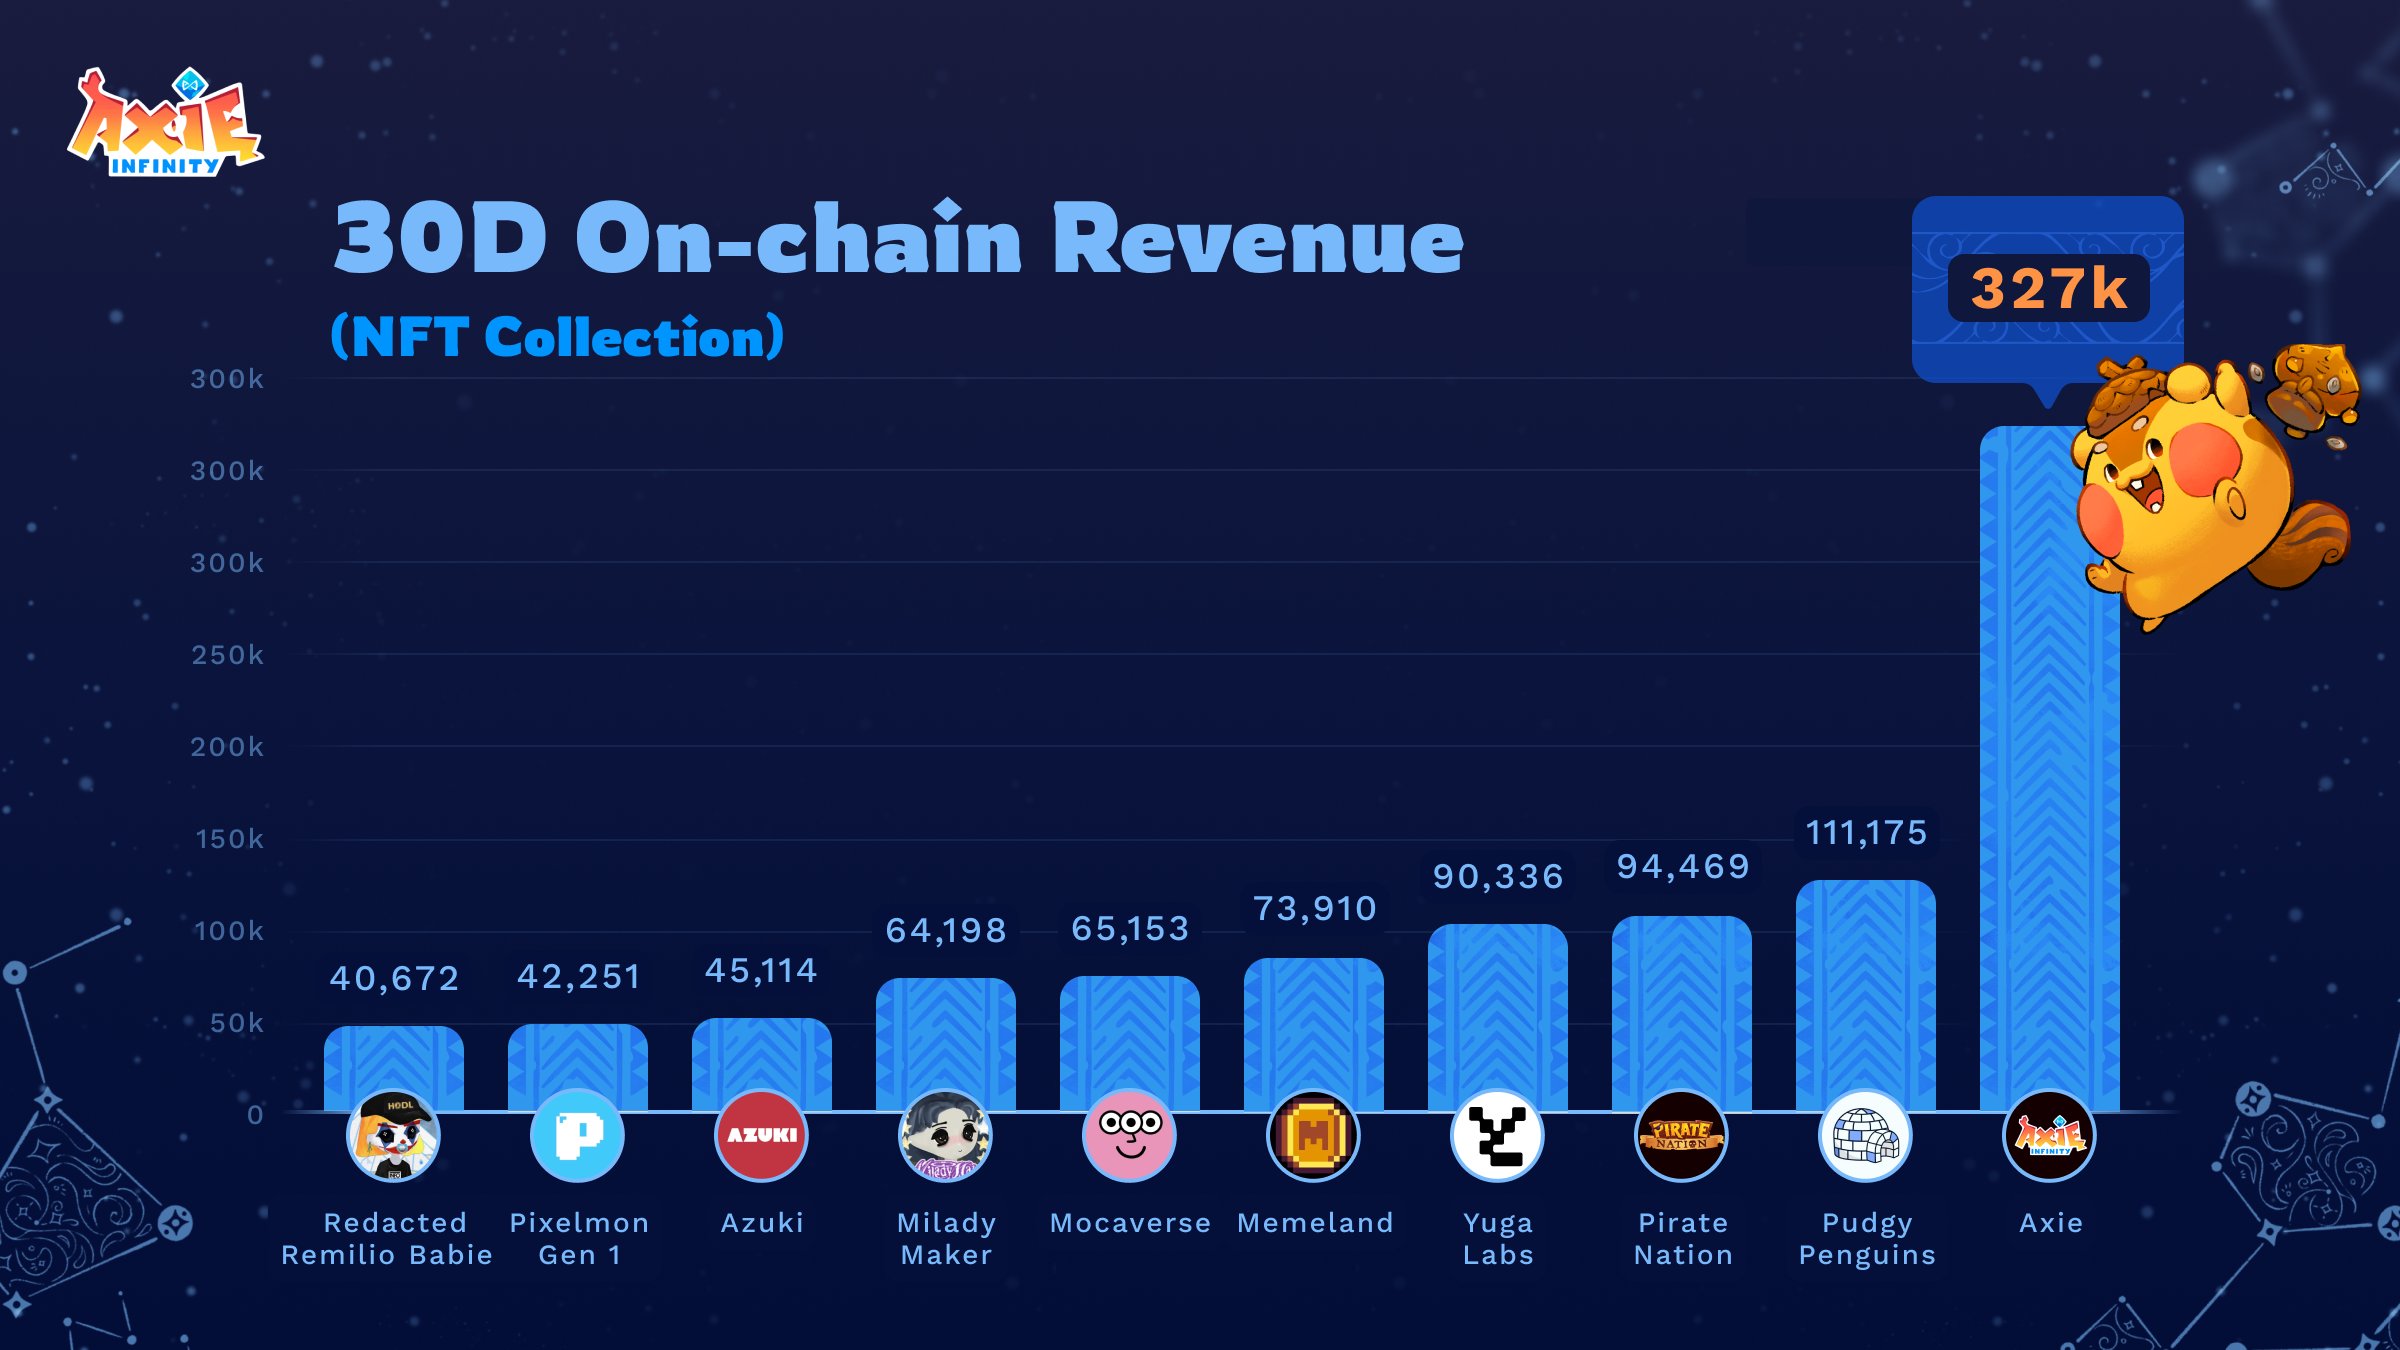
30-day on-chain revenue of the NFT collection
Co-founder of Axie Infinity shared statistics from the Coinbase learn-to-earn campaign in mid-June. @Jihoz_Axie dropped key details of the campaign that evidence the rising demand for the NFTs and the relevance among traders:
- 236,000 total participants engaged with Axies
- 202,000 Axies were purchased
- Axie treasury noted a 99% surge in weekly fees paid, up from $50,685 to $100,843, during the first ten days of the campaign.
In the 10 days since the start of the Coinbase learn to earn campaign:
— Jihoz.ron (@Jihoz_Axie) June 14, 2024
• 236k total participants
• 202k axies purchased vs 48k in the 10 day window prior to the campaign
• Origins and Classic DAU up 10%
• 570 Eth in marketplace traded in the last 10 days an increase of 165%… pic.twitter.com/htkIBVNfxi
AXS/USDT daily chart shows a 45% decline in the GameFi token’s price in the same timeframe where Axies collection noted a surge in revenue and monthly active users. It is likely that the token’s price has failed to catch up with the popularity of the NFT collection.
Axie Infinity’s AXS could extend gains by 6% and rally towards the Fair Value Gap at $6.661, as seen in the chart below. The GameFi token could make steady progress towards recovering from the 45% correction.
The Moving Average Convergence Divergence (MACD) momentum indicator supports the bullish thesis. Green histogram bars appeared above the neutral line on the AXS/USDT daily chart, as seen below, signaling positive momentum underlying AXS price trend.
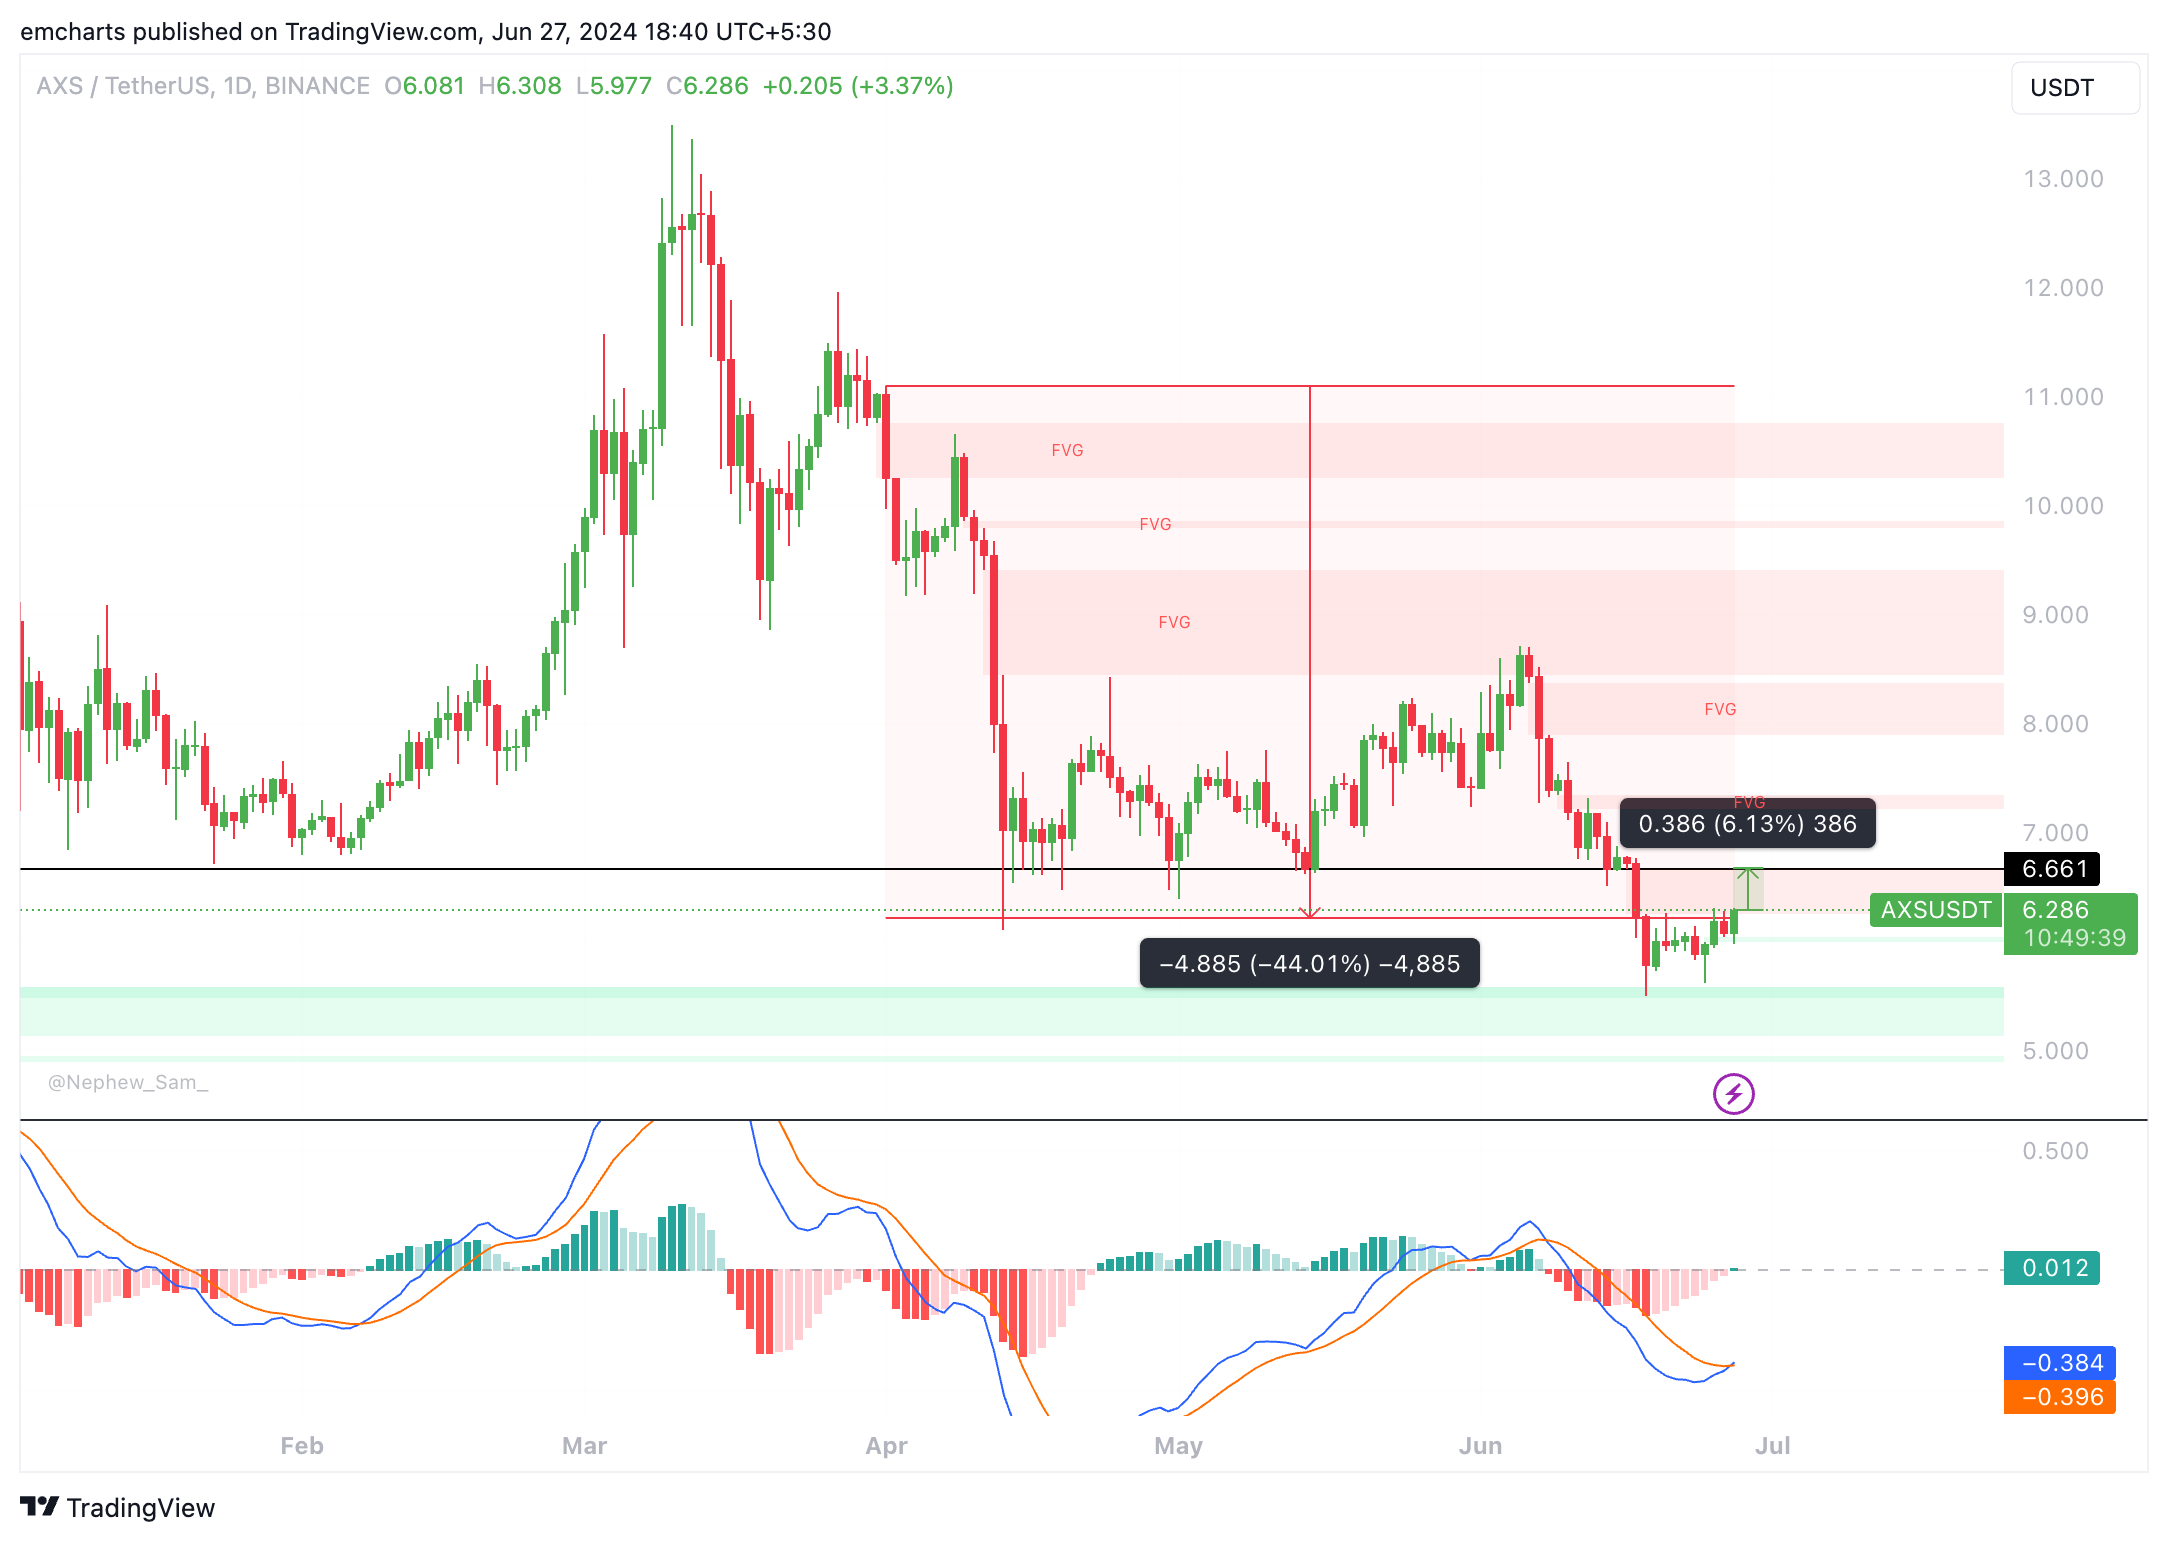
AXS/USDT daily chart
If AXS fails to extend gains, it could find support at the Fair Value Gap between $5.996 and $6.036.
Artigos Recomendados


