
Toncoin price poised to break the all-time high
- Toncoin price tested the ascending trendline support on Monday, trades at fresh weekly highs on Thursday.
- On-chain data suggests growing activity and interest within the TON’s ecosystem.
- A daily candlestick close below $6.88 would invalidate the bullish thesis.
Toncoin’s (TON) price tested the ascending trendline support on Monday, rebounding by 10% and currently trading at fresh weekly highs around $7.65 as of Thursday. Increasing activity and interest within the TON’s ecosystem indicate a potential setup for Toncoin to surpass its previous all-time high.
Toncoin price shows potential
Toncoin price has established three consecutive higher lows and four nearly equal highs since April 11, forming an ascending triangle pattern on the daily chart when connecting these swing points with a trendline. This technical formation typically indicates a bullish bias.
However, TON broke out of the ascending triangle pattern on June 14, reaching a new all-time high of $8.29 on June 15. This breakout was short-lived and turned out to be a fakeout, trapping long-position traders. Subsequently, TON experienced a sharp decline of approximately 15%, to test the ascending trendline support, which coincided with the 61.8% Fibonacci retracement level at $6.886. This event led to the liquidation of leveraged long positions, followed by the opening of new long positions. Currently, TON is trading around the $7.65 mark at the time of writing.
If Toncoin surpasses the $8.29 level, it could rally by 19%, aiming for a new all-time high of $9.82. This target corresponds to the 141.40% Fibonacci extension level, drawn from the swing low of $4.60 on May 1 to the swing high of $8.29 on June 15.
The Relative Strength Index (RSI) and Awesome Oscillator (AO) indicators are firmly above their respective mean values of 50 and zero, indicating that the bullish momentum is still in control.
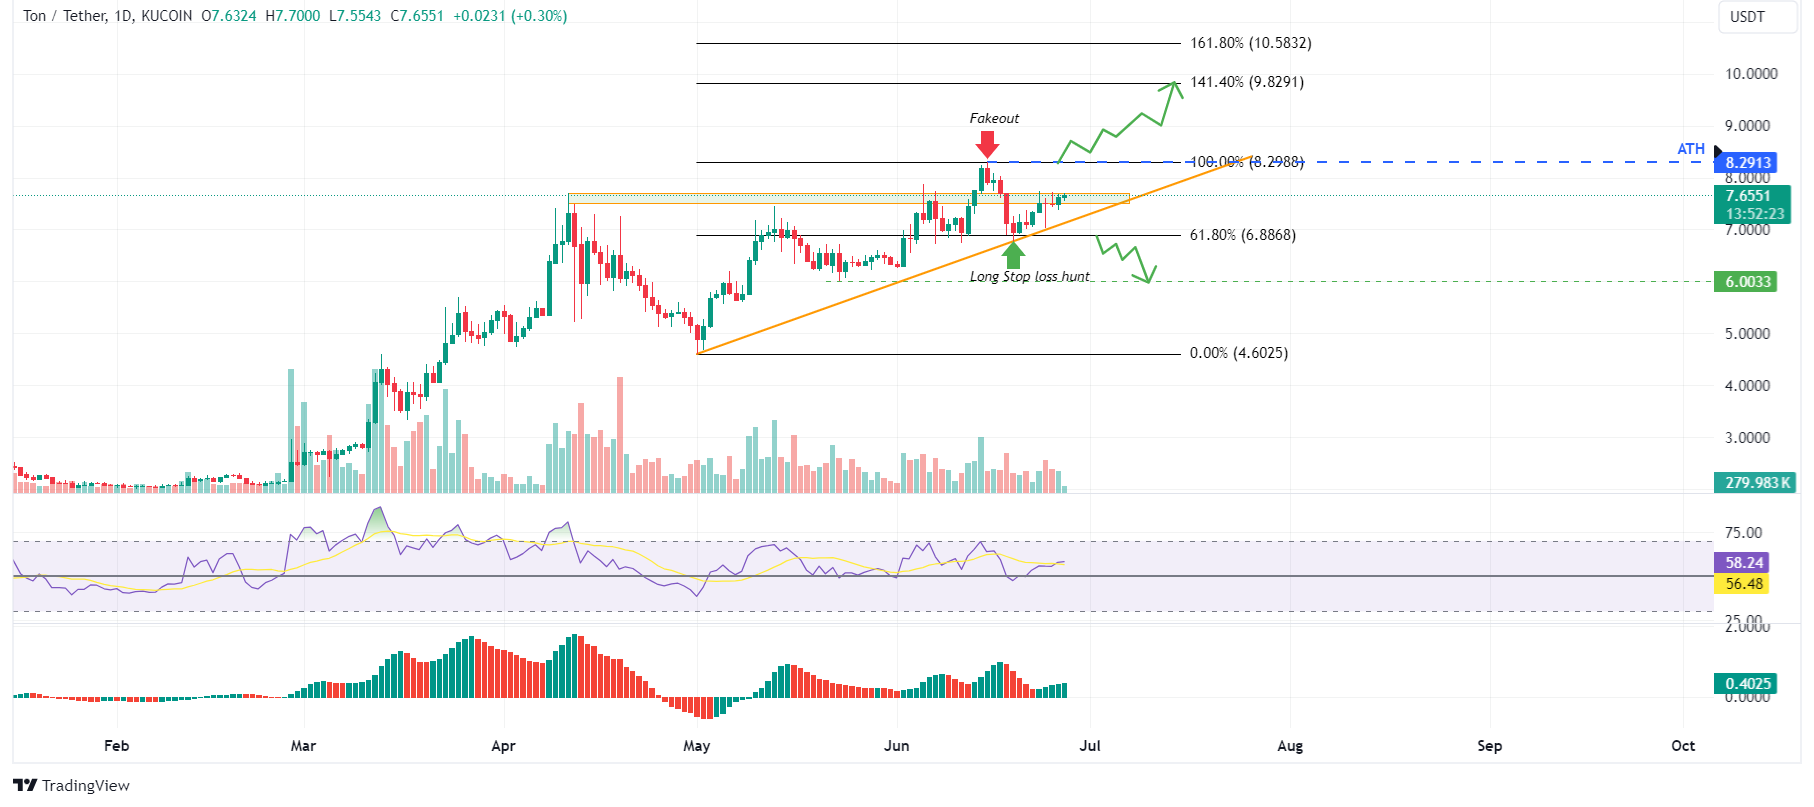
TON/USDT daily chart
According to data from the Coinglass Total Liquidations chart, on June 18, long positions totaling $1.34 million were liquidated, significantly higher than the $155,890 in short positions. This data corresponds with the technical analysis previously outlined.
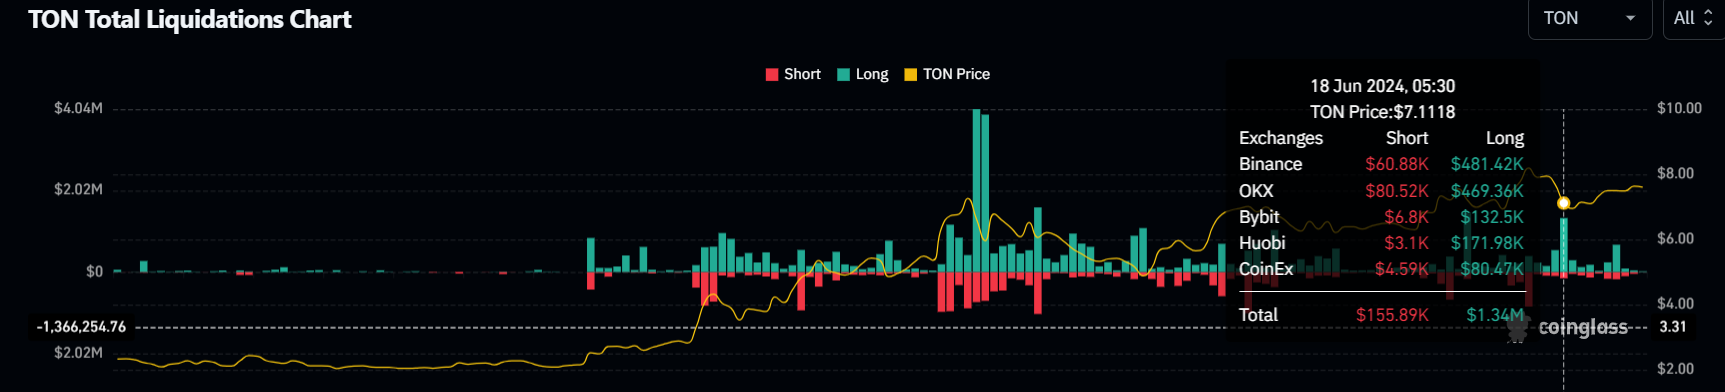
TON Total Liquidations chart
TON's Open Interest data shows a notable increase, rising from $255.28 million on June 20 to $305.16 million on June 27, marking a 19.5% surge. This uptick, coupled with the price appreciation, suggests an influx of new capital and heightened buying activity in the market. This data further corroborates the technical analysis discussed earlier.
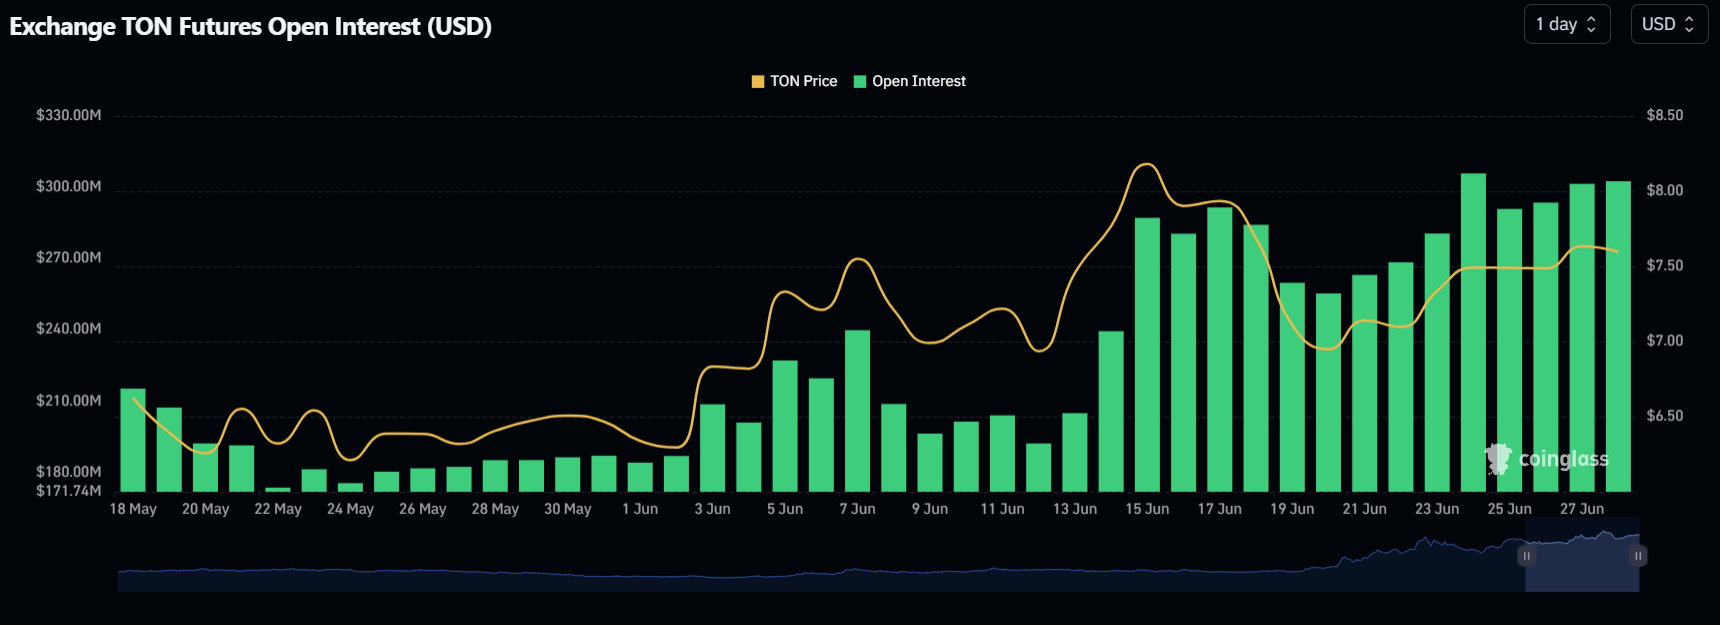
TON Open Interest chart
Additionally, crypto intelligence tracker DefiLlama data shows that TON’s Total Value Locked (TVL) has increased from $582.36 million on June 19 to an all-time high of $678.79 million on June 14.
This 17% increase in TVL indicates growing activity and interest within the TON’s ecosystem. It suggests that more users are depositing or utilizing assets within TON-based protocols, adding further credence to the bullish outlook.
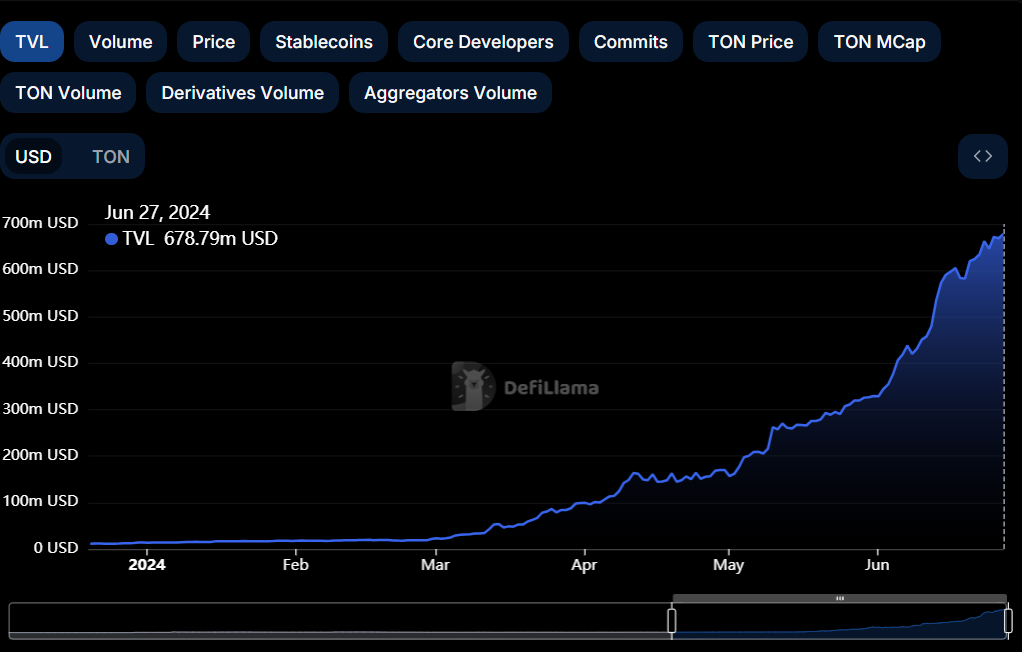
TON TVL chart
Despite the bullish thesis signaled by both on-chain data and technical analysis, if TON breaks the upward trendline of the triangle and closes below $6.88, the outlook would shift to bearish. This scenario could lead to a crash of 13% to $6.00, the daily low from May 23.
Artigos Recomendados


