
Ripple extends decline as XRP traders realize losses around $0.47
- Ripple holders realized losses on their XRP tokens for the ninth consecutive day on Thursday.
- Traders have taken over $41 million in losses since June 18, according to Santiment data.
- XRP hovers around $0.47, wiping out over 5% in value in the past seven days.
Ripple (XRP) holds the recent decline at around $0.47 on Thursday. On-chain data shows that different cohorts of XRP investors reacted differently to the price decline, with whales holding between 1 million and 10 million XRP distributing their token holdings at a loss.
Typically, an asset is expected to recover after a capitulation.
Daily digest market movers: Ripple on-chain data shows traders are realizing losses
- Ripple on-chain data from tracker Santiment shows that XRP investors took over $41 million in unrealized losses between June 18 and June 27, as shown in the chart below.
- The negative spikes in the Network Realized Profit/oLss metric show the losses taken by XRP traders in the past nine days. Consistent realization of losses by traders is considered typical of a capitulation.
 [15.07.58, 27 Jun, 2024]-638550845652244358.png)
Network realized profit/ loss vs. price
- Different segments of XRP investors reacted differently to the price decline. Wallet addresses holding between 10,000 and 100,000 XRP tokens and 100,000 and 1 million coins accumulated the asset, buying the dip.
- The group of investors holding between 1 million and 10 million XRP distributed their holdings at a loss. Typically, this segment is associated with capitulation prior to recovery in the asset’s price, as seen in the chart below.
 [15.38.27, 27 Jun, 2024]-638550846153740138.png)
XRP supply distribution
- In the absence of an update in the SEC vs. Ripple lawsuit, traders are watching Bitcoin price trends for cues to determine where XRP is headed.
- XRP is hovering around $0.47, down nearly 5% in the past seven days.
Technical analysis: Ripple likely to extend losses by 3.5%
Ripple is in a downward trend, hovering around the $0.47 level on Thursday. If the decline resumes, XRP is likely to touch support at $0.4508, the June 7 low. In the event of a recovery in the altcoin’s price, XRP could fill the Fair Value Gap between $0.4731 and $0.4710 before resuming its downward trend.
The Moving Average Convergence Divergence (MACD) indicator supports the bearish thesis, with the signal line crossing above the MACD line and the red histogram bars under the neutral line. There is underlying negative momentum in Ripple’s price trend.
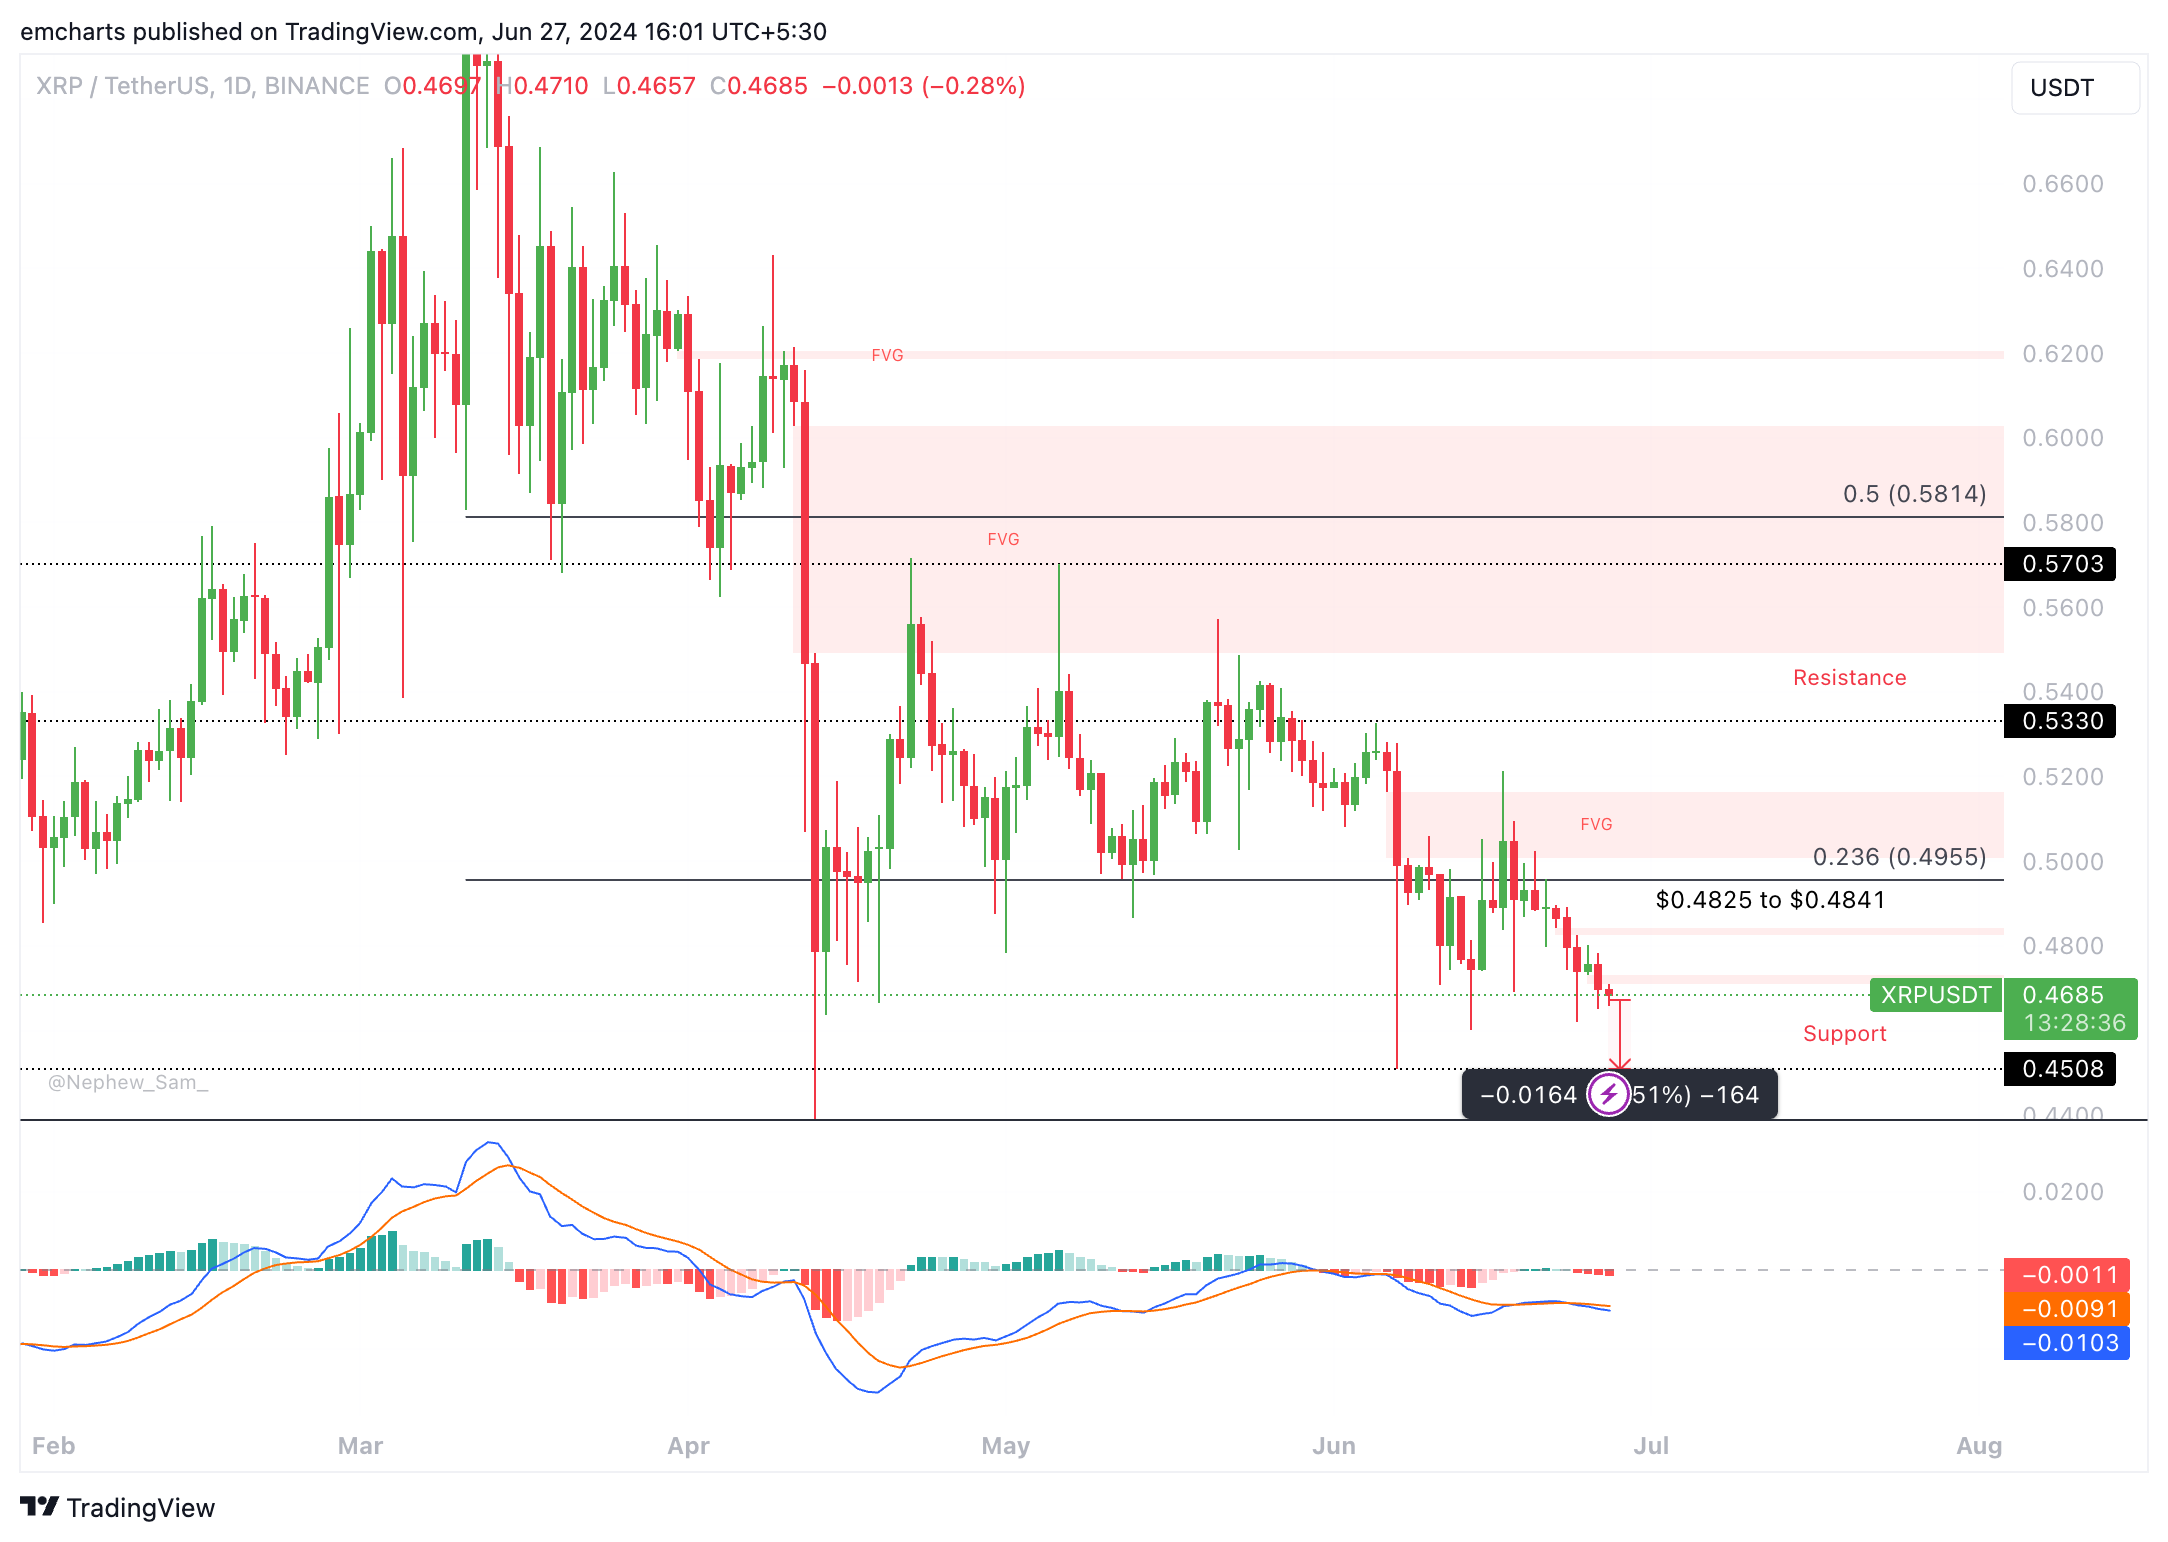
XRP/USDT daily chart
Ripple’s close above the Fair Value Gap between $0.4825 and $0.4841 could invalidate the bearish thesis and push XRP higher toward the resistance at $0.4955.
Bitcoin, altcoins, stablecoins FAQs
Bitcoin is the largest cryptocurrency by market capitalization, a virtual currency designed to serve as money. This form of payment cannot be controlled by any one person, group, or entity, which eliminates the need for third-party participation during financial transactions.
Altcoins are any cryptocurrency apart from Bitcoin, but some also regard Ethereum as a non-altcoin because it is from these two cryptocurrencies that forking happens. If this is true, then Litecoin is the first altcoin, forked from the Bitcoin protocol and, therefore, an “improved” version of it.
Stablecoins are cryptocurrencies designed to have a stable price, with their value backed by a reserve of the asset it represents. To achieve this, the value of any one stablecoin is pegged to a commodity or financial instrument, such as the US Dollar (USD), with its supply regulated by an algorithm or demand. The main goal of stablecoins is to provide an on/off-ramp for investors willing to trade and invest in cryptocurrencies. Stablecoins also allow investors to store value since cryptocurrencies, in general, are subject to volatility.
Bitcoin dominance is the ratio of Bitcoin's market capitalization to the total market capitalization of all cryptocurrencies combined. It provides a clear picture of Bitcoin’s interest among investors. A high BTC dominance typically happens before and during a bull run, in which investors resort to investing in relatively stable and high market capitalization cryptocurrency like Bitcoin. A drop in BTC dominance usually means that investors are moving their capital and/or profits to altcoins in a quest for higher returns, which usually triggers an explosion of altcoin rallies.
Artigos Recomendados


