
EUR/USD thin gains mired in congestion ahead of key US inflation on Friday
- EUR/USD found some bullish interest on Thursday, but momentum remains limited.
- German labor figures due early Friday, market impact sect to be limited.
- US PCE Price Index inflation to cap off the trading week.
EUR/USD found a thin bid on Thursday, but the pair continues to grind into the midrange near the 1.0700 handle as half-hearted bidders shuffle their feet ahead of Friday’s key US inflation print. European economic data has been strictly mid-tier in the back half of the trading week, leaving markets to turn an eye towards US Personal Consumption Expenditure Price Index (PCE) inflation, due during Friday’s upcoming US market window.
Forex Today: US inflation comes to the fore... again
European data prints moderately softened on Thursday, with the pan-EU Economic Sentiment Indicator ticking down to 95.9 from the previous 96.0, missing the forecast increase to 96.2. Friday’s German Unemployment change is forecast to show 15K net new jobless benefits seekers in June, down from the previous 25K while the seasonally-adjusted Unemployment Rate in June is expected to hold steady at 5.9%.
US Initial Jobless Claims for the week ended Jun 21 came in better than expected, showing 233K net new jobless benefits seekers compared to the forecast 236K, and down slightly further from the previous week’s 238K. The four-week average for Initial Jobless Claims jumped to 236K, bringing the newest week-on-week figure back below the running average.
US Gross Domestic Product (GDP) met expectations on Thursday, with Q1 GDP slightly revised to 1.4% from the initial print of 1.3%. Core Personal Consumption Expenditures in the first quarter also rose slightly, ticking up to 3.7% QoQ versus the forecast hold at 3.6%. Thursday’s upcoming Presidential debate, due to start after the day’s market close, will draw some attention as investors keep an eye out for possible policy hints from candidates.
Friday’s US PCE Price Index inflation print will be the week’s key data figure as investors hope for continued cooling in US inflation numbers to help push the Federal Reserve (Fed) closer toward rate cuts. At current cut, core PCE Price Index inflation is forecast to tick down to 0.1% MoM in May from 0.2%.
Economic Indicator
Core Personal Consumption Expenditures - Price Index (MoM)
The Core Personal Consumption Expenditures (PCE), released by the US Bureau of Economic Analysis on a monthly basis, measures the changes in the prices of goods and services purchased by consumers in the United States (US). The PCE Price Index is also the Federal Reserve’s (Fed) preferred gauge of inflation. The MoM figure compares the prices of goods in the reference month to the previous month.The core reading excludes the so-called more volatile food and energy components to give a more accurate measurement of price pressures. Generally, a high reading is bullish for the US Dollar (USD), while a low reading is bearish.
Read more.Next release: Fri Jun 28, 2024 12:30
Frequency: Monthly
Consensus: 0.1%
Previous: 0.2%
Source: US Bureau of Economic Analysis
After publishing the GDP report, the US Bureau of Economic Analysis releases the Personal Consumption Expenditures (PCE) Price Index data alongside the monthly changes in Personal Spending and Personal Income. FOMC policymakers use the annual Core PCE Price Index, which excludes volatile food and energy prices, as their primary gauge of inflation. A stronger-than-expected reading could help the USD outperform its rivals as it would hint at a possible hawkish shift in the Fed’s forward guidance and vice versa.
EUR/USD technical outlook
The Fiber caught a Thursday bid as the pair bounced from a demand zone priced in below 1.0680, driving back into the 200-hour Exponential Moving Average (EMA) 1.0717 before settling back into the 1.0700 handle heading into Friday’s market session.
EUR/USD is getting caught in a congestion trap on daily candlesticks, drifting into the low end of a rough descending channel as the pair waffles on the bearish side of the 200-day Exponential Moving Average (EMA) at 1.0785.
EUR/USD hourly chart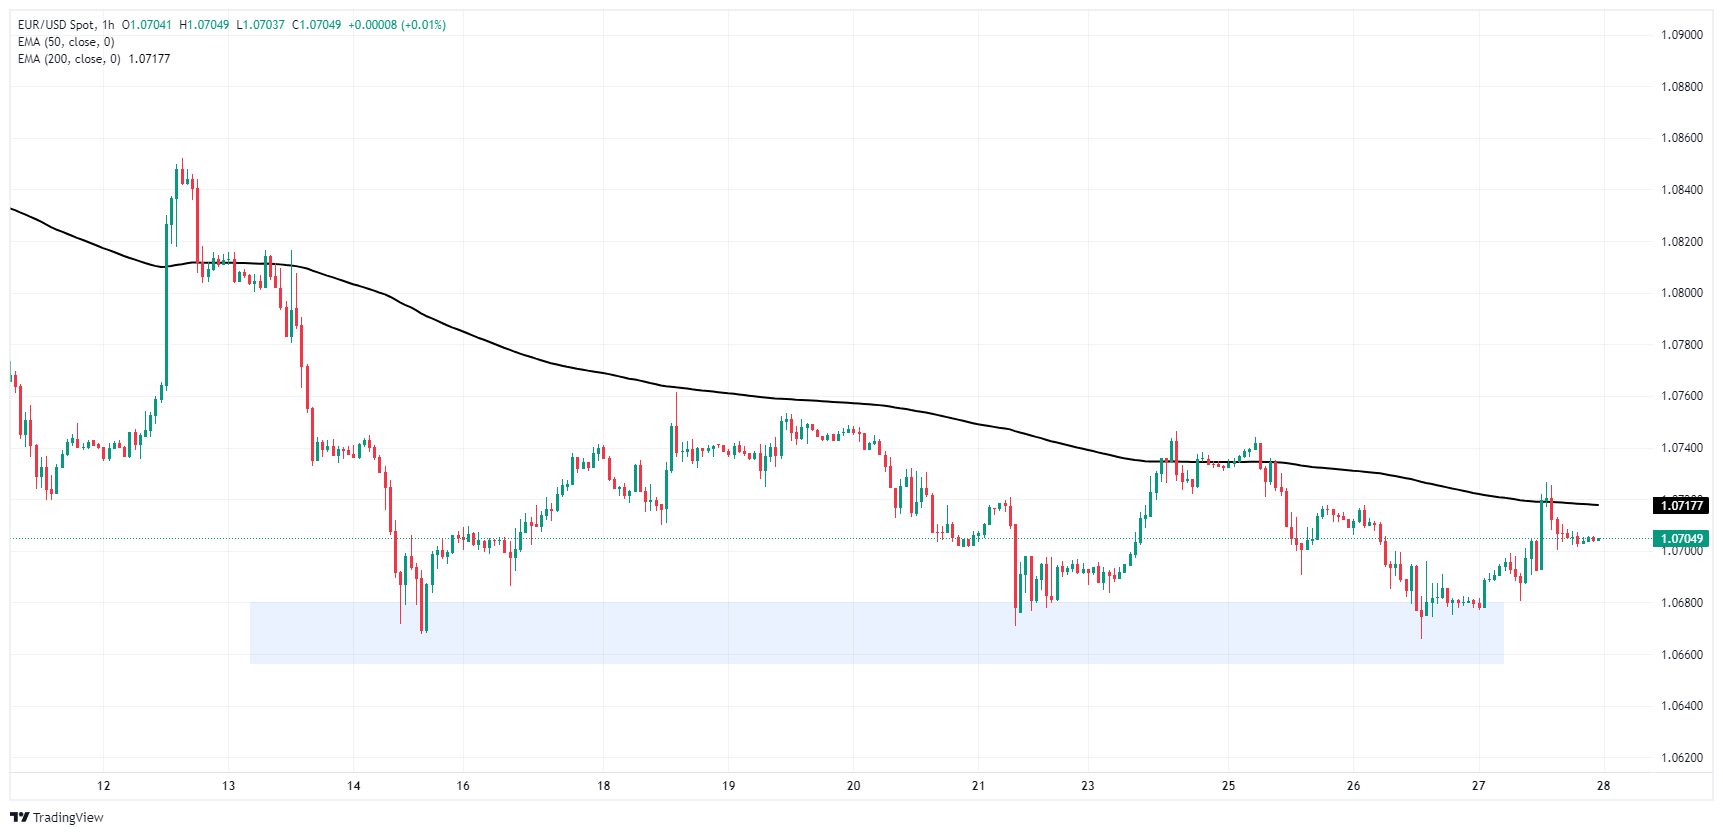
EUR/USD daily chart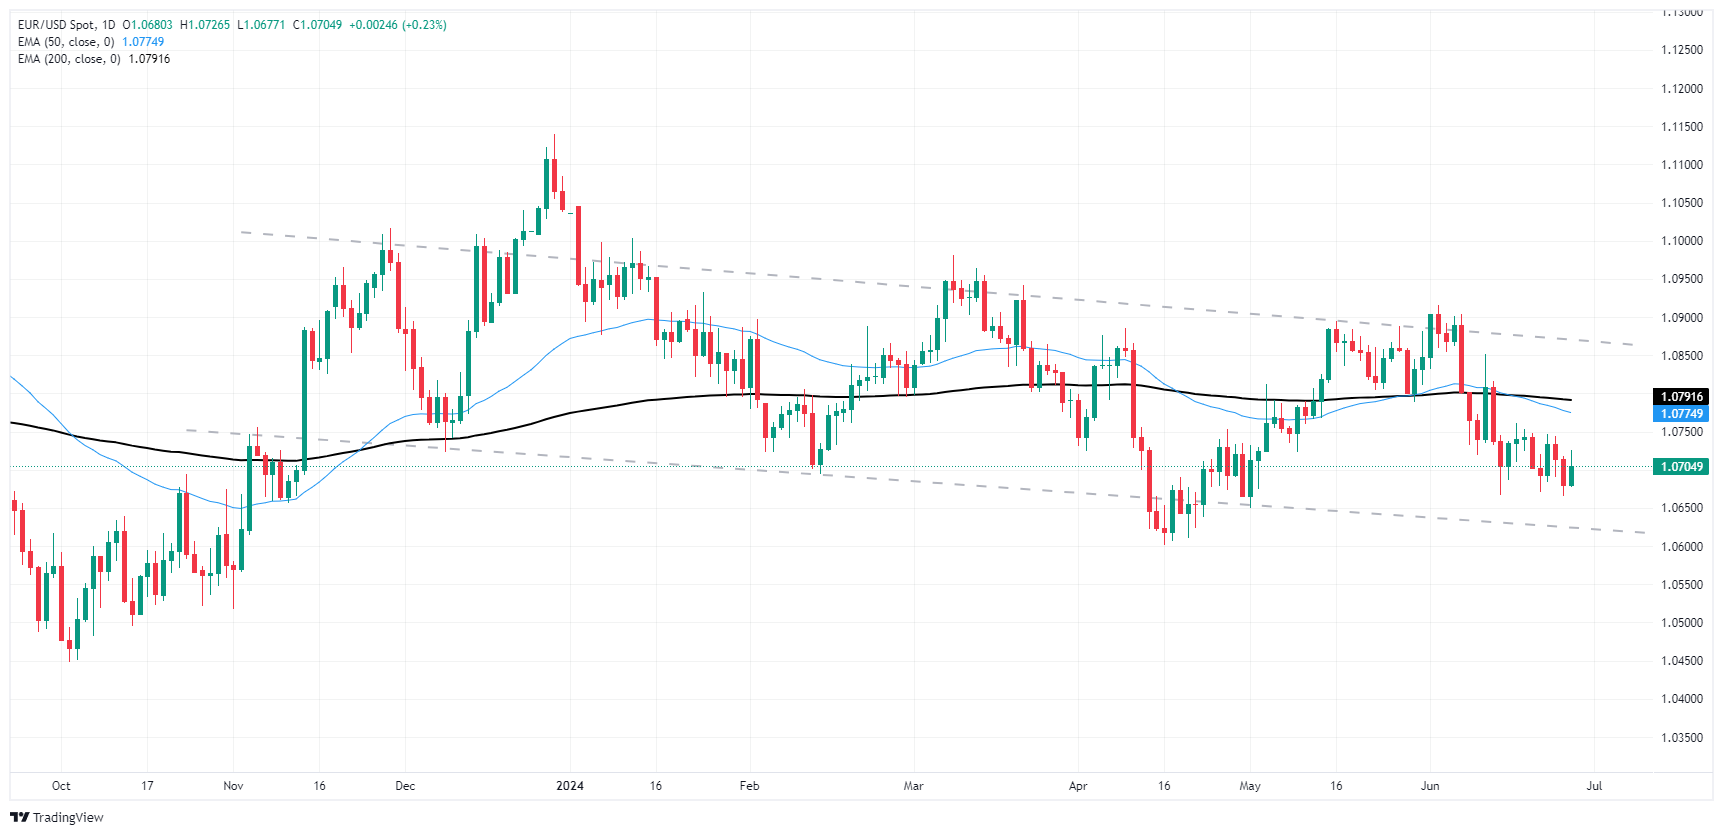
Canadian Dollar FAQs
The key factors driving the Canadian Dollar (CAD) are the level of interest rates set by the Bank of Canada (BoC), the price of Oil, Canada’s largest export, the health of its economy, inflation and the Trade Balance, which is the difference between the value of Canada’s exports versus its imports. Other factors include market sentiment – whether investors are taking on more risky assets (risk-on) or seeking safe-havens (risk-off) – with risk-on being CAD-positive. As its largest trading partner, the health of the US economy is also a key factor influencing the Canadian Dollar.
The Bank of Canada (BoC) has a significant influence on the Canadian Dollar by setting the level of interest rates that banks can lend to one another. This influences the level of interest rates for everyone. The main goal of the BoC is to maintain inflation at 1-3% by adjusting interest rates up or down. Relatively higher interest rates tend to be positive for the CAD. The Bank of Canada can also use quantitative easing and tightening to influence credit conditions, with the former CAD-negative and the latter CAD-positive.
The price of Oil is a key factor impacting the value of the Canadian Dollar. Petroleum is Canada’s biggest export, so Oil price tends to have an immediate impact on the CAD value. Generally, if Oil price rises CAD also goes up, as aggregate demand for the currency increases. The opposite is the case if the price of Oil falls. Higher Oil prices also tend to result in a greater likelihood of a positive Trade Balance, which is also supportive of the CAD.
While inflation had always traditionally been thought of as a negative factor for a currency since it lowers the value of money, the opposite has actually been the case in modern times with the relaxation of cross-border capital controls. Higher inflation tends to lead central banks to put up interest rates which attracts more capital inflows from global investors seeking a lucrative place to keep their money. This increases demand for the local currency, which in Canada’s case is the Canadian Dollar.
Macroeconomic data releases gauge the health of the economy and can have an impact on the Canadian Dollar. Indicators such as GDP, Manufacturing and Services PMIs, employment, and consumer sentiment surveys can all influence the direction of the CAD. A strong economy is good for the Canadian Dollar. Not only does it attract more foreign investment but it may encourage the Bank of Canada to put up interest rates, leading to a stronger currency. If economic data is weak, however, the CAD is likely to fall.
Artigos Recomendados


