
GBP/JPY extends into further multi-year highs on Thursday
- GBP/JPY touches fresh 16-year highs as Yen continues to backslide.
- Japanese Retail Trade ticked higher, Tokyo CPI inflation next on the docket.
- UK GDP revision slated for Friday, little change expected.
GBP/JPY tapped a fresh 16-year high of 203.39 on Thursday as the Yen continues ot get pushed lower across the board. An uptick in Japanese Retail Sales early Thursday failed to spark a recovery in the Yen as JPY traders buckle down for the last print of Japan’s Tokyo Consumer Price Index (CPI) inflation due early Friday.
The UK will also be delivering a fresh revision to first-quarter Gross Domestic Product (GDP) figures, but little change is expected and Q1 UK GDP is expected to hold steady at 0.6%, in-line with the initial print.
Core Tokyo CPI is expected to tick upwards slightly to 2.0% YoY in June, but the upswing is likely not enough to push the Bank of Japan (BoJ) out of its stubborn, long-running hypereasy monetary policy stance. With BoJ reference rates functionally at zero and a significant ratio of Japanese government bonds scooped up by the Japanese central bank itself, the Yen’s battered stance is unlikely to change, regardless of a carousel of increasingly concerned threats of direct intervention in FX markets by Japan’s Ministry of Finance.
Economic Indicator
Tokyo Consumer Price Index (YoY)
The Tokyo Consumer Price Index (CPI), released by the Statistics Bureau of Japan on a monthly basis, measures the price fluctuation of goods and services purchased by households in the Tokyo region. The index is widely considered as a leading indicator of Japan’s overall CPI as it is published weeks before the nationwide reading. The YoY reading compares prices in the reference month to the same month a year earlier. Generally, a high reading is seen as bullish for the Japanese Yen (JPY), while a low reading is seen as bearish.
Read more.Next release: Thu Jun 27, 2024 23:30
Frequency: Monthly
Consensus: -
Previous: 2.2%
Source: Statistics Bureau of Japan
GBP/JPY technical outlook
The Guppy has traded so firmly traded into the bullish side in one-sided action that the pair has not pulled back to the 200-day Exponential Moving Average (EMA) since the start of 2024 when the pair briefly eased below the 180.00 handle before proceeding to climb over 13% from January’s opening bids at 179.55.
GBP/JPY has set a fresh 16-year high for five consecutive days in lopsided bullish action, and the pair has likewise chalked in nine straight green trading days as the pair continues to climb into multi-year peaks.
GBP/JPY hourly chart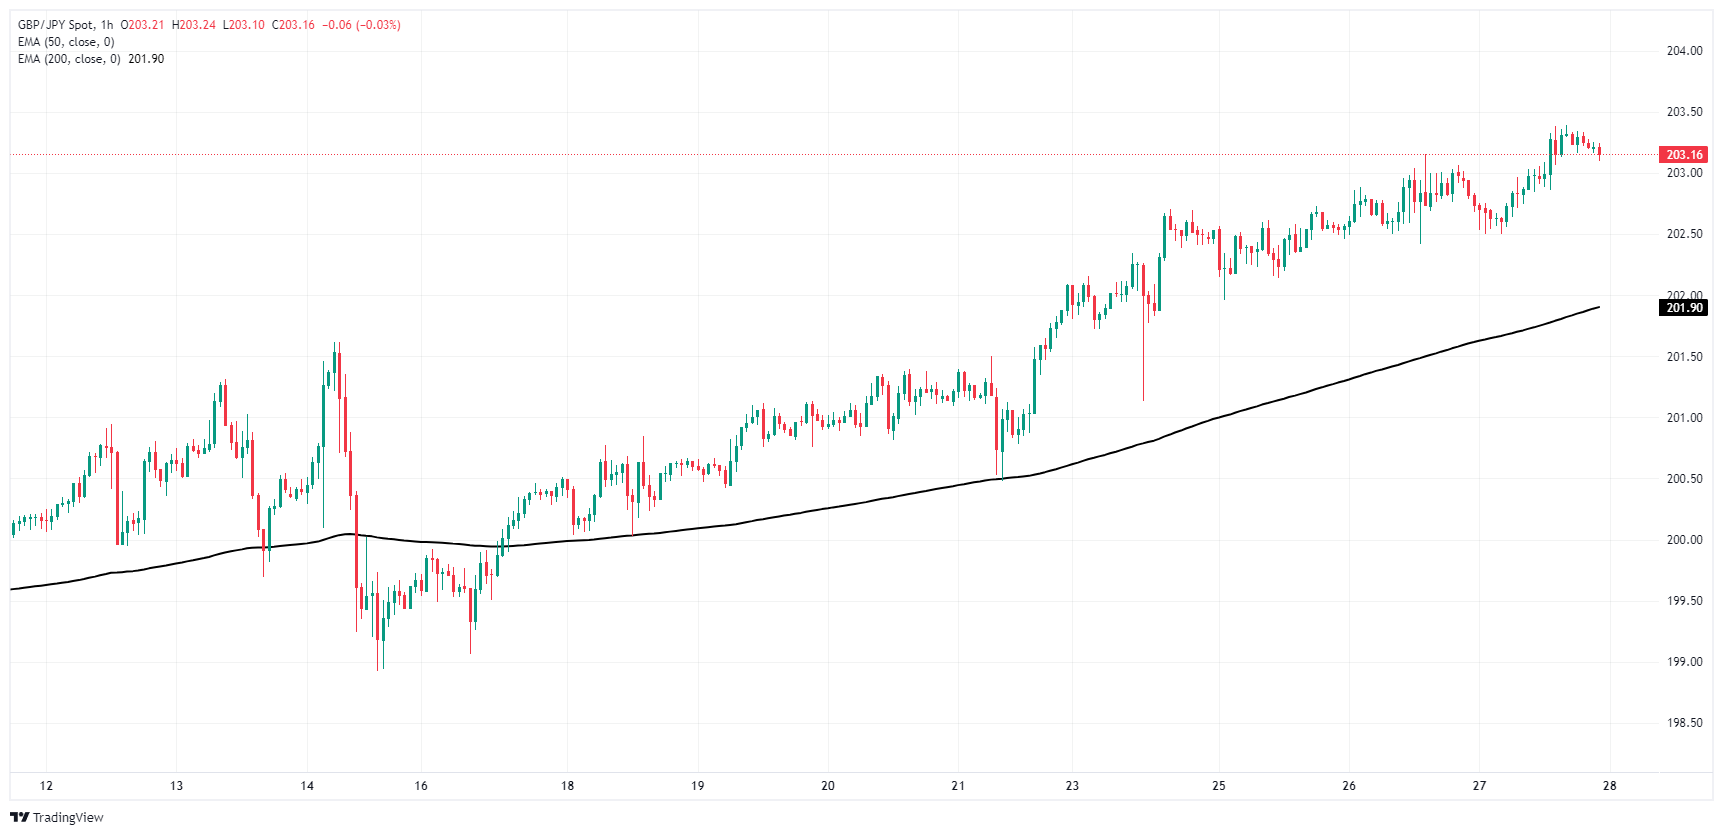
GBP/JPY daily chart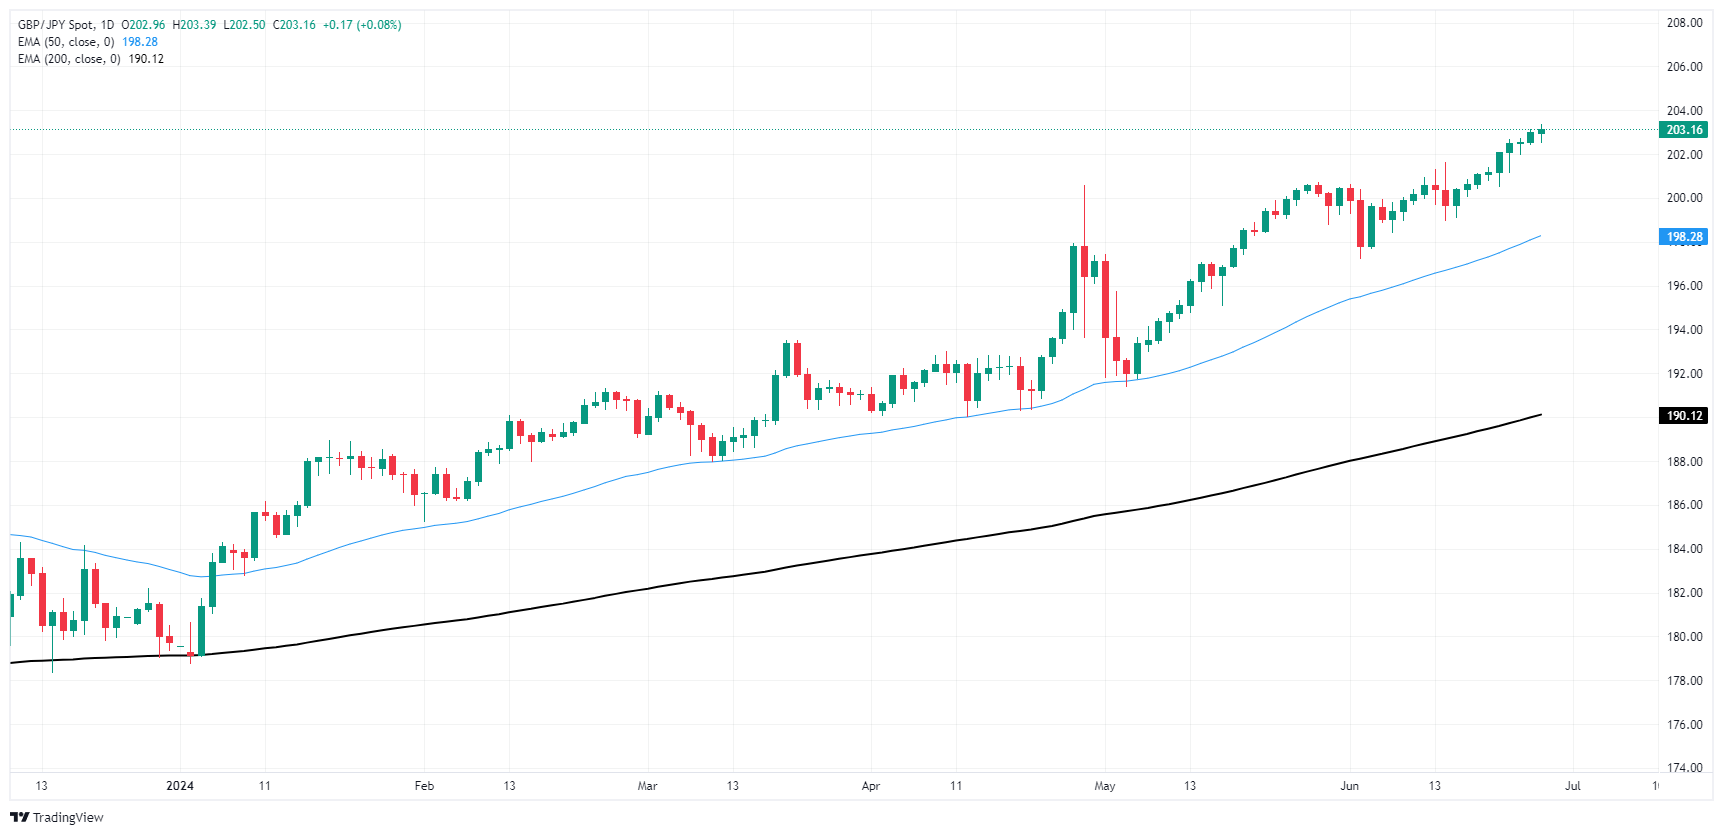
Artigos Recomendados


