NZD/JPY Price Analysis: Cross extends gains to multi-year highs around 97.50

Source Fxstreet
Jun 24, 2024 21:37
  • Buyers successfully clear previous losses, stabilizing the cross at 97.80
  • The 20-day SMA at 96.60 remains an important support, defending against sellers' attempts.
  • Approaching overbought conditions suggests a potential correction, although the overall outlook remains positive.

On Monday, the NZD/JPY pair recorded a low of 97.28 before buyers stepped in and cleared all losses, stabilizing the cross at around 97.80. The potent performance fortified the bullish sentiment, with the pair glowing at highs not seen since July 2007, but in entered the Asian session on a neutral note. In the last sessions, the 20-day Simple Moving Average (SMA) at 96.60 has emerged as strong support, with sellers yet unable to breach this level, serving to further solidify the positive outlook.

The daily Relative Strength Index (RSI) currently reads 67, indicating higher momentum than Friday's reading and continues to suggest an upward trend. Meanwhile, the Moving Average Convergence Divergence (MACD) for Monday presents a fresh green bar, indicating increased buying pressure. However, investors are advised caution as the RSI nears the overbought threshold, hinting at the possibility of a near-term correction.

NZD/JPY daily chart
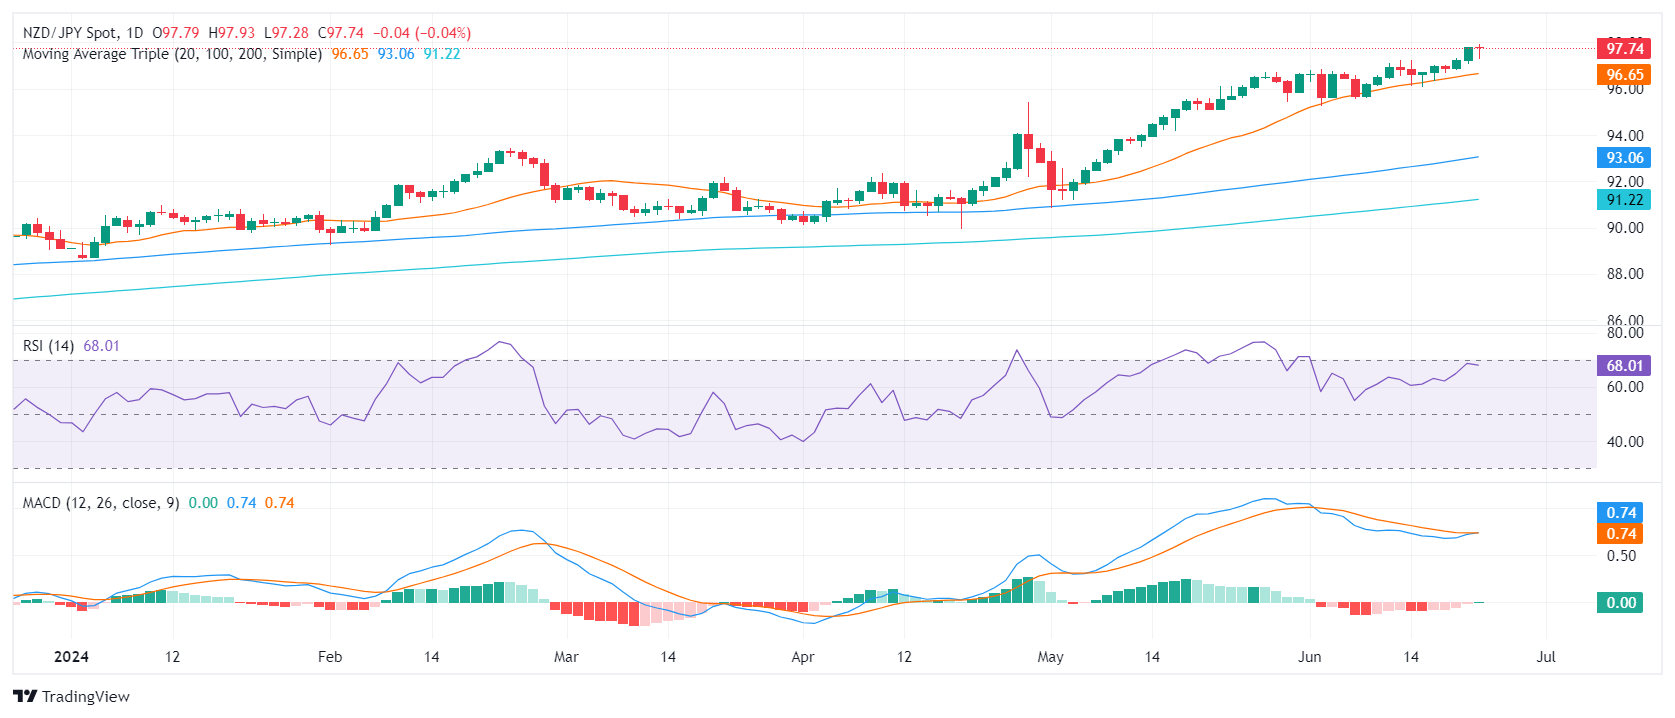
The bulls' resilience in maintaining positions above the 20-day SMA remains steadfast. This, combined with the approaching overbought daily technical indicators, further reinforces the positive technical outlook of the Kiwi against the Yen.

In subsequent trading sessions, the cross may fluctuate between the immediate support at 97.00 and the resistance target at 98.00. Investors should monitor these levels for a break above the consolidation range, indicating continued upward movement, or a breach below the 20-day SMA, which could signal a deeper correction. The 97.30 area also showed itself as a strong support.

NZD/JPY

Overview
Today last price 97.79
Today Daily Change 0.01
Today Daily Change % 0.01
Today daily open 97.78
 
Trends
Daily SMA20 96.59
Daily SMA50 94.58
Daily SMA100 92.98
Daily SMA200 91.16
 
Levels
Previous Daily High 97.8
Previous Daily Low 97.08
Previous Weekly High 97.8
Previous Weekly Low 96.09
Previous Monthly High 96.74
Previous Monthly Low 90.83
Daily Fibonacci 38.2% 97.53
Daily Fibonacci 61.8% 97.36
Daily Pivot Point S1 97.31
Daily Pivot Point S2 96.84
Daily Pivot Point S3 96.6
Daily Pivot Point R1 98.03
Daily Pivot Point R2 98.27
Daily Pivot Point R3 98.74


Disclaimer: For information purposes only. Past performance is not indicative of future results.
placeholder
Japan Consumer Confidence Index: 37.2 (December) vs 36.1Japan Consumer Confidence Index: 37.2 (December) vs 36.1
Author  Saqib Iqbal
Japan Consumer Confidence Index: 37.2 (December) vs 36.1
placeholder
China Industrial Production (YoY) above forecasts (5.6%) in November: Actual (6.6%)China Industrial Production (YoY) above forecasts (5.6%) in November: Actual (6.6%)
Author  Sam Sam
China Industrial Production (YoY) above forecasts (5.6%) in November: Actual (6.6%)
placeholder
"Verbal Intervention" Escalates! Is the Bank of Japan about to turn hawkish?Last week (9/4-9/8), the US Dollar Index rose by 0.82%, while most non-US currencies experienced a decline. Specifically, the Euro depreciated by 0.7% against the US dollar, and the Japanese Yen weakened by approximately 1.1%.
Author  Mitrade
Last week (9/4-9/8), the US Dollar Index rose by 0.82%, while most non-US currencies experienced a decline. Specifically, the Euro depreciated by 0.7% against the US dollar, and the Japanese Yen weakened by approximately 1.1%.
placeholder
英文专题文章英文专题文章英文专题文章英文专题文章英文专题文章英文专题文章英文专题文章英文专题文章英文专题文章英文专题文章英文专题文章
Author  Sam Sam
英文专题文章英文专题文章英文专题文章英文专题文章英文专题文章英文专题文章英文专题文章英文专题文章英文专题文章英文专题文章
placeholder
MakerDAO establishes 4 subDAOs: What impact does it have on the price of MKR? MKR's daily K-line chart has formed four consecutive positives. The bulls are relatively strong and have the opportunity to rise to 123 or even 13 million US dollars.
Author  Mitrade
MKR's daily K-line chart has formed four consecutive positives. The bulls are relatively strong and have the opportunity to rise to 123 or even 13 million US dollars.
goTop
quote