
NZD/USD Price Analysis: Kiwi plunges, outlook hinges on SMA convergence support
- On Wednesday, NZD/USD dives further, approaching 100 and 200-day Simple SMA convergence.
- The Kiwi's outlook could skew bearish as the pair nears losing the significant 0.6070 threshold.
On Wednesday, the NZD/USD took a big hit, with the pair plunging towards the convergence of the 100 and 200-day Simple Moving Averages (SMAs) near the 0.6070 level. Pressure mounts on the pair and further losses could be on the horizon if the bears fail to defend this crucial area.
The Relative Strength Index (RSI) for the NZD/USD pair on the daily chart plummeted to 42, suggesting a deepening bearish momentum. Even though it hasn't reached the oversold threshold yet, the declining trend is visible. The Moving Average Convergence Divergence (MACD) indicates bearish sentiment with rising red bars, affirming the stronger position of the sellers.
NZD/USD daily chart
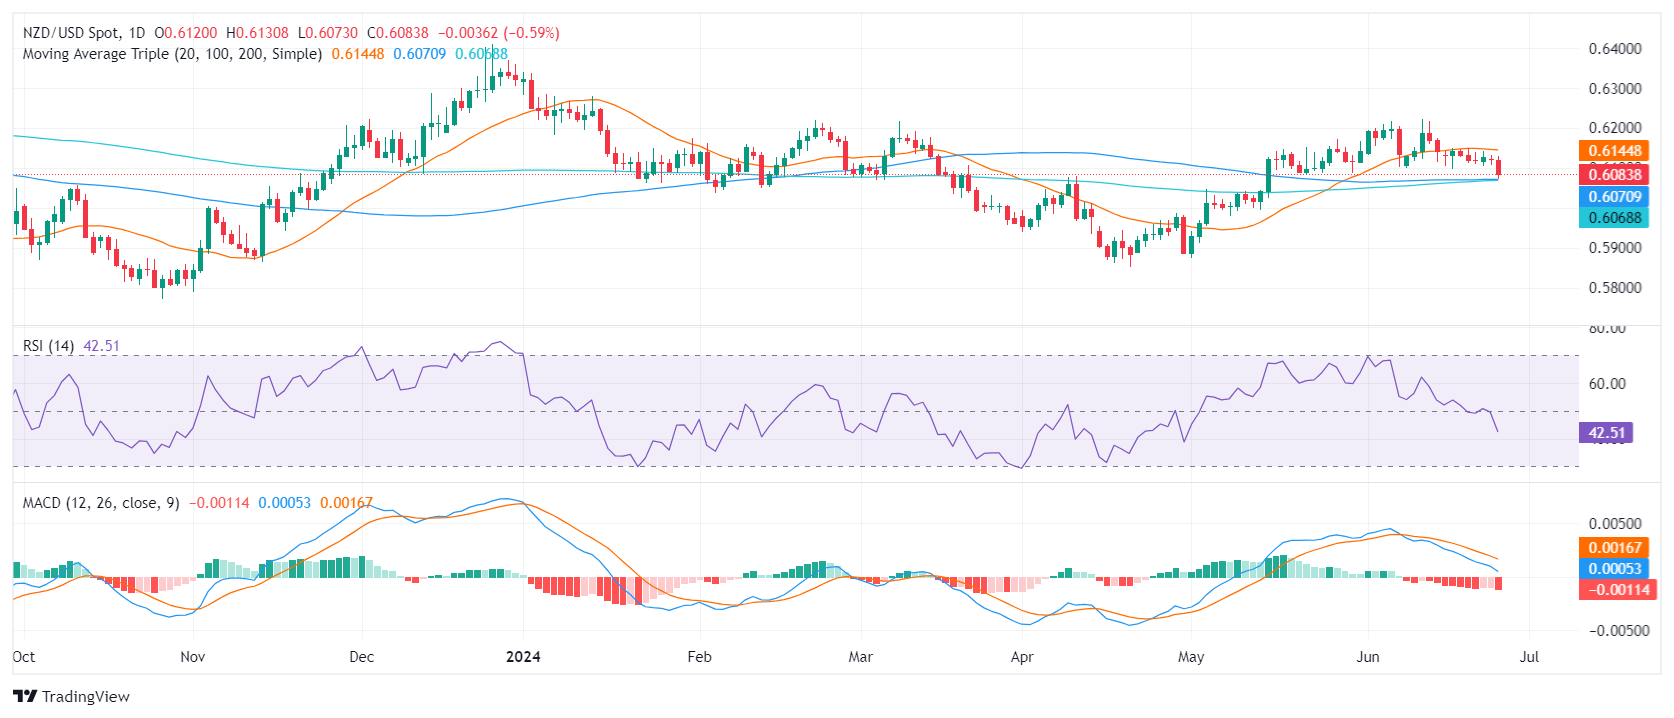
The NZD/USD finds immediate support near the 0.6070 threshold coinciding with the converging 100 and 200-day SMAs. Additional support is lurking lower at 0.6050. A breakdown below these SMAs would validate a deeper sell-off scenario.
On the flip side, resistance is now at the former support level of 0.6100. The 20-day SMA at 0.6145 offers additional resistance, followed by resistance points at 0.6170 and 0.6200. A decisive breakout above these levels could signal a termination of the current bearish trend and a shift in favor of the bulls.
Empfohlene Artikel


