NZD/USD Price Analysis: Kiwi trades sideways, outlook hinges on SMA convergence
- NZD/USD moved sideways with mild losses while pair remains under the 20-day SMA.
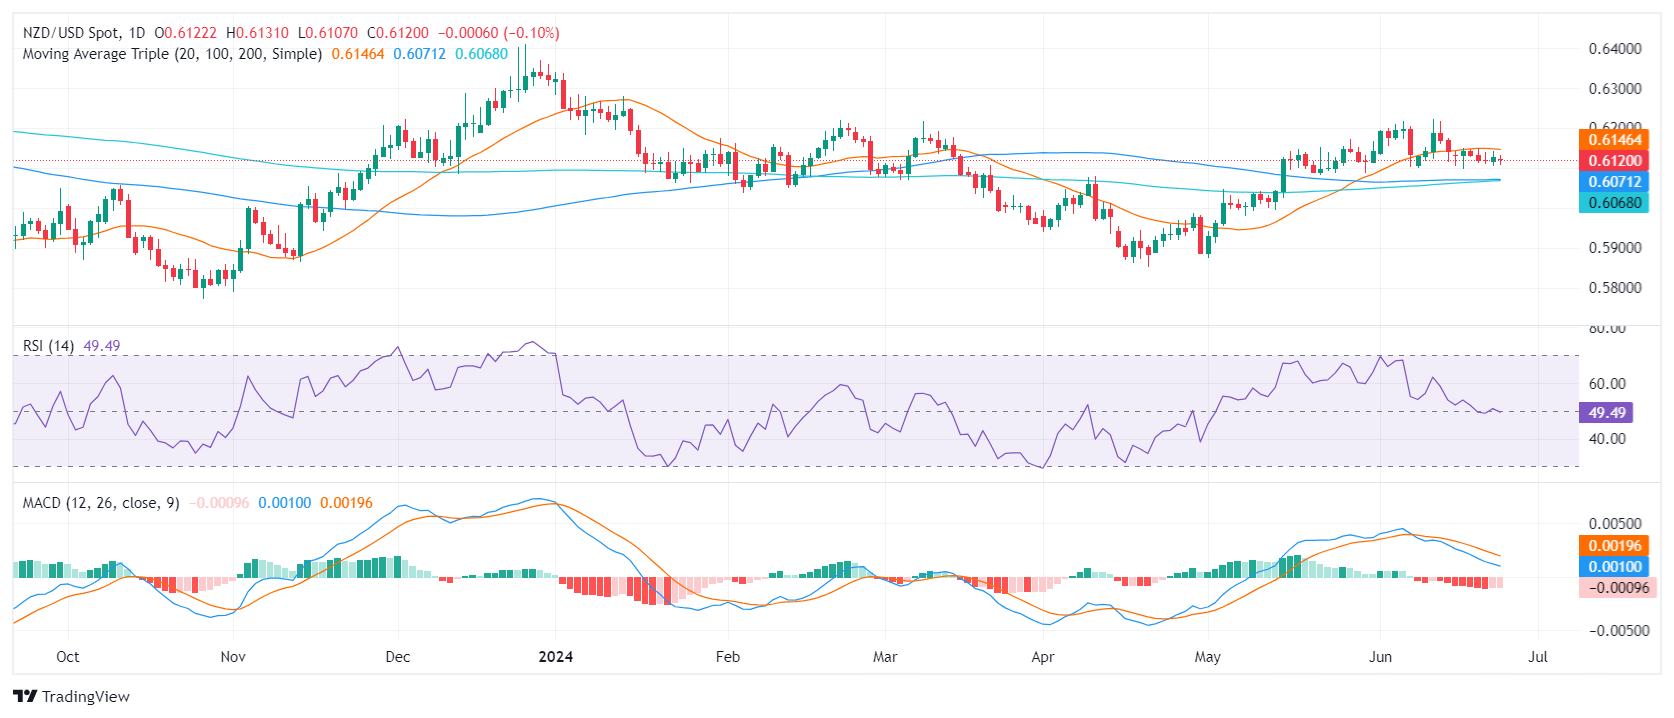
- The Kiwi's outlook continues to skew bearish in the short term while the 100 and 200-day SMAs converge at 0.6070 potentially brightening the broader picture.
- Despite the bearish sentiment, a break above 0.6150, the position of the 20-day SMA, would change direction.
On Tuesday, the NZD/USD continues to trade sideways with minor losses. Sellers have consolidated their stance and taken the pair under the 20-day Simple Moving Average (SMA). Despite this, the convergence of the 100 and 200-day SMAs at 0.6070 could paint a more optimistic picture if they complete a bullish crossover.
The Relative Strength Index (RSI) on the daily chart fell to 49, suggesting more bearishness. Still, despite the downward shift, the RSI remains near the neutral zone. The Moving Average Convergence Divergence (MACD) remains flat with red bars, showcasing a seller's market.
NZD/USD daily chart

The NZD/USD finds immediate support near the 0.6100 level. Beneath that, additional support is available at the converging 100 and 200-day SMAs at 0.6070. If the pair continues its descent, these levels could provide a robust defense. A failure to hold these SMAs could signal a deepening of the sell-off scenario.
Conversely, resistance remains at the 20-day SMA at 0.6150, with additional resistance points at 0.6170 and 0.6200. A decisive breakout above these levels might indicate an end to the current bearish market sentiment and a shift in favor of the bulls.


